Indexing Common Crawl Metadata on Elasticsearch using Cascading


If you want to explore how to parallelize the data ingestion into Elasticsearch, please have a look to this post I have written for Amazon AWS:

http://blogs.aws.amazon.com/bigdata/post/TxC0CXZ3RPPK7O/Indexing-Common-Crawl-Metadata-on-Amazon-EMR-Using-Cascading-and-Elasticsearch

It explains how to index Common Crawl metadata into Elasticsearch using Cascading connector directly from the S3 data source.

Cascading Source Code is available here.

How Ganglia works


What is Ganglia ?

Ganglia is a scalable distributed monitoring system for high-performance computing systems such as clusters and Grids. It is based on a hierarchical design targeted at federations of clusters. It leverages widely used technologies such as XML for data representation, XDR for compact, portable data transport, and RRDtool for data storage and visualization.

ganglia

Ganglia has the following main components:

1. Ganglia Monitoring Daemon (gmond)
Gmond stands for ganglia monitoring daemon. It is a lightweight service that is installed on every machine you’d like to monitor.
Gmond has four main responsibilities:

1.1 Monitor changes in host state.
1.2 Announce relevant changes.
1.3 Listen to the state of all other ganglia nodes via a unicast or multicast channel.
1.4 Answer requests for an XML description of the cluster state.

Each gmond transmits information in two different ways:

a. Unicasting or Multicasting host state in external data representation (XDR) format using UDP messages.
b. Sending XML over a TCP connection.

Notes about gmond:

– The main configuration file of gmond is /etc/gmond.conf
– gmond is multithreaded

Test gmond installation:

telnet localhost 8649

You should see XML that conforms to the ganglia XML spec.

Or

gmond -d 5 -c /etc/ganglia/gmond.conf

to see the service in debugging mode.

2. Ganglia Meta Daemon (gmetad)
The ganglia meta daemon (gmetad) is a service that collects data from other gmetad and gmond sources and stores their state to disk in indexed round-robin (RRD) databases. Gmetad provides a simple query mechanism for collecting specific information about groups of machines.

Notes about gmetad:

– the main configuration file for gmetad is /etc/gmetad.conf
– You need atleast one gmetad daemon installed node on each cluster.
– This gemetad daemon is the one who collects data send by gmond daemon.
– All other nodes other than the one in the cluster, do not require gmetad daemon to be installed.
– If you need the machine containing gmetad configured as node to be monitored, then in that case you need to install both gmond and gmetad on the machine.

Test gmetad installation:

telnet localhost 8651

3. Ganglia PHP Web Front-end
The Ganglia web front-end provides a view of the gathered information via real-time dynamic web pages. Most importantly, it displays Ganglia data in a meaningful way for system administrators and computer users using PHP.

how ganglia works

In this picture we can see  gmond installed in each node and sending data to gmetad installed in a “gmetad node”. We can have one or more  “nodes with gmetad” in a cluster.

gmetad collects all the data from gmond and stores it in rrdtool database. Which is then collected by the php scripts, and showed as the first picture in this article.

4. Gmetrics
The ganglia metric tool is a commandline application that you can use to inject custom made metrics about hosts that are being monitored by ganglia. It has the ability to spoof messages as coming from a different host in case you want to capture and report metrics from a device where you don’t have gmond running (like a network or other embedded device).

5. Gstat
The ganglia stat tool is a commandline application that you can use to query a gmond for metric information directly.

6. RRD tool:

Ganglia uses RRD tool to store its data and visualization.

RRD tool is the short form for Round Robin Data base tool. This is a wonderful and useful open source data base tool. In this RRD stores data in time-series. For example RRD tool will store all values of CPU load at a certain time interval and then graph these data according to time.

HBase useful commands


1) Connect to HBase. Connect to your running instance of HBase using the hbase shell command, located in the bin/ directory of your HBase install.

$ ./bin/hbase shell 
hbase(main):001:0>

2) Create a table. Use the create command to create a new table. You must specify the table name and the ColumnFamily name.

hbase(main):001:0> create 'test', 'cf' 
0 row(s) in 0.4170 seconds 

=> Hbase::Table - test

3) List Information About your Table.

hbase(main):002:0> list 'test'
TABLE 
test 
1 row(s) in 0.0180 seconds 

=> ["test"]

4) Put data into your table. Here, we insert three values, one at a time. The first insert is at row1, column cf:a, with a value of value1. Columns in HBase are comprised of a column family prefix, cf in this example, followed by a colon and then a column qualifier suffix, a in this case.

hbase(main):003:0> put 'test', 'row1', 'cf:a', 'value1' 
0 row(s) in 0.0850 seconds 

hbase(main):004:0> put 'test', 'row2', 'cf:b', 'value2' 
0 row(s) in 0.0110 seconds 

hbase(main):005:0> put 'test', 'row3', 'cf:c', 'value3' 
0 row(s) in 0.0100 seconds

5) Scan the table for all data at once. One of the ways to get data from HBase is to scan. Use the scan command to scan the table for data. You can limit your scan, but for now, all data is fetched.

hbase(main):006:0> scan 'test' 
ROW COLUMN+CELL
 row1 column=cf:a, timestamp=1421762485768, value=value1
 row2 column=cf:b, timestamp=1421762491785, value=value2
 row3 column=cf:c, timestamp=1421762496210, value=value3
3 row(s) in 0.0230 seconds

6) Get a single row of data.

hbase(main):007:0> get 'test', 'row1'
COLUMN CELL
 cf:a timestamp=1421762485768, value=value1 

1 row(s) in 0.0350 seconds

7) Disable a table. If you want to delete a table or change its settings, as well as in some other situations, you need to disable the table first, using the disable command. You can re-enable it using the enable command.

hbase(main):008:0> disable 'test' 
0 row(s) in 1.1820 seconds 

hbase(main):009:0> enable 'test' 
0 row(s) in 0.1770 seconds

8) Disable the table again if you tested the enable command above:

hbase(main):010:0> disable 'test' 
0 row(s) in 1.1820 seconds

9) Drop the table.

hbase(main):011:0> drop 'test' 
0 row(s) in 0.1370 seconds

10) Backup and restore to S3:

10.1) BackUp:

hadoop jar /home/hadoop/lib/hbase.jar emr.hbase.backup.Main --backup --backup-dir s3://your-bucket/backups/j-XXXX

10.2) Restore:

hadoop jar /home/hadoop/lib/hbase.jar emr.hbase.backup.Main --restore --backup-dir s3://your-bucket/backup-hbase/j-XXXX'

10.3) Import:

hbase org.apache.hadoop.hbase.mapreduce.Import test s3n://your-bucket/backup-hbase/j-XXXX

11) Backup and Restore with Distcp and S3distCp:

11.1) Using Distcp method to backup to S3:

hadoop distcp hdfs://ec2-52-16-22-167.eu-west-1.compute.amazonaws.com:9000/hbase/ s3://your-bucket/hbase/201502280715/

11.2) Using Distcp to backup to another cluster:

hadoop distcp hdfs://ec2-52-16-22-167.eu-west-1.compute.amazonaws.com:9000/hbase/ hdfs://ec2-54-86-229-249.compute-1.amazonaws.comec2-2:9000/hbase/

11.3) Using S3distcp method to backup to S3:

hadoop jar ~/lib/emr-s3distcp-1.0.jar --src hdfs:///hbase/ --dest s3://your-bucket/hbase/201502280747/

Hive: Extracting JSON fields


Handling JSON files with Hive is not always an easy task.

If you need to extract some specific fields from a structured JSON, we have some alternatives:

There are two UDF functions that are usually helpful on this cases: ‘get_json_object’ and ‘json_tuple’. These functions allows you to access json fields from Hive without installing additional libraries.

get_json_object:

https://cwiki.apache.org/confluence/display/Hive/LanguageManual+UDF#LanguageManualUDF-get_json_object

json_tuple:

https://cwiki.apache.org/confluence/display/Hive/LanguageManual+UDF#LanguageManualUDF-json_tuple

To navigate JSON structure with get_json_object, the entire JSON file has to be mapped as string.

As example:

1) Create the external table as string:

CREATE EXTERNAL TABLE json_table (str string) LOCATION 's3://mybucket/input/jsonserde' ;

2) select field[0] from store.fruit field:

select get_json_object(json_table.str, '$.store.fruit\[0]') as MyField from json_table;

Elasticsearch and Kibana on EMR Hadoop cluster


If you need to add Elasticsearch and Kibana on EMR, please have a look to this post I have written for Amazon AWS:

http://blogs.aws.amazon.com/bigdata/post/Tx1E8WC98K4TB7T/Getting-Started-with-Elasticsearch-and-Kibana-on-Amazon-EMR

It contains all the steps to launch a cluster and perform the basic testings on both tools.

Additionally, here you will find the source code for the bootstrap actions used to configure Elasticsearch and Kibana on the EMR Hadoop cluster:

https://github.com/awslabs/emr-bootstrap-actions/tree/master/elasticsearch


Versión en Español

Si necesitas Elasticsearch y Kibana instalado en un cluster  EMR, por favor, mira esta publicacion que he escrito para Amazon AWS:

http://blogs.aws.amazon.com/bigdata/post/Tx1E8WC98K4TB7T/Getting-Started-with-Elasticsearch-and-Kibana-on-Amazon-EMR

Contiene todos los pasos para crear un cluster y realizar las pruebas basicas en las dos herramientas.

Adicionalmente, aqui encontraras el codigo fuente para las bootstrap actions que uso para instalar Elasticsearch y Kibana en el EMR Hadoop cluster.

https://github.com/awslabs/emr-bootstrap-actions/tree/master/elasticsearch

YARN / Map Reduce memory settings


On Hadoop 1, we used to use mapred.child.java.opts to set the Java Heap size for the task tracker child processes.

With YARN, that parameter has been deprecated in favor of:

  • mapreduce.map.java.opts – These parameter is passed to the JVM for mappers.
  • mapreduce.reduce.java.opts – These parameter is passed to the JVM for reducers.

The key thing to understand is that if both mapred.child.java.opts and mapreduce.{map|reduce}.java.opts are specified, the settings in mapred.child.java.opts will be ignored.

The way to set values to these variables is, as example:

mapreduce.map.java.opts = -Xmx1280m
mapreduce.reduce.java.opts= -Xmx2304m

A common error that we will see on our application if it try to run beyond those limits is, as example:

.YarnChild.main(YarnChild.java:162)\nCaused by: java.lang.OutOfMemoryError: Java heap space\

Now, assuming an error like mentioned is at reduce phase, we can increase the value for mapreduce.reduce.java.opts to:

mapreduce.reduce.java.opts = -Xmx3584m

But, we will face another error if we do not increase mapreduce.reduce.memory.mb variable accordingly:

mapreduce.reduce.memory.mb = 4096

A typical error message when Container memory available is lower than maximum Java Heap size is:

containerID=container_1420691746319_0001_01_000151] is running beyond physical memory limits. Current usage: 2.6 GB of 2.5 GB physical memory used; 4.8 GB of 12.5 GB virtual memory used. Killing container.

The general rule of thumb to use is that -Xmx (mapreduce.reduce.java.opts) should be 80% of the size of the equivalent mapreduce.reduce.memory.mb value to account for stack and PermGen space.

As a Summary:

Mapper and Reducer Settings:

  • mapreduce.map.memory.mb – This defines the overall size of the JVM that is used by your mappers.  This value is in megabytes (MB).
  • mapreduce.reduce.memory.mb – This defines the overall size of the JVM that is used by your reducers.  This value is in megabytes (MB).

Yarn-MAP-REDUCE-MB

Containers

As we should know by now, on YARN memory allocation…everything is a container. This includes the following components:

  • Application Master – It controls the execution of the application (such as re-running tasks when they fail).
  • Mappers – Process all of the input files and grab the information out of them necessary to perform the job.
  • Reducers – These containers take information from the mappers and distill it into the final result of the job (which goes into the output files.)

Global Settings

This two properties handles containers memory allocation:

  • yarn.scheduler.minimum.allocation.mb – This is the smallest allowed value for a container.  Any requests for a container that ask for a value smaller than this will be set to this value.  This value is in megabytes (MB).
  • yarn.scheduler.maximum.allocation.mb – This is the largest allowed value for a container.  Any requests for a container that ask for a value larger than this will be set to this value.  This value is in megabytes (MB)


Hadoop 1 vs Hadoop 2


There are a lot of articles about this, but, I just needed a good summary of concepts:

Hadoop 1:

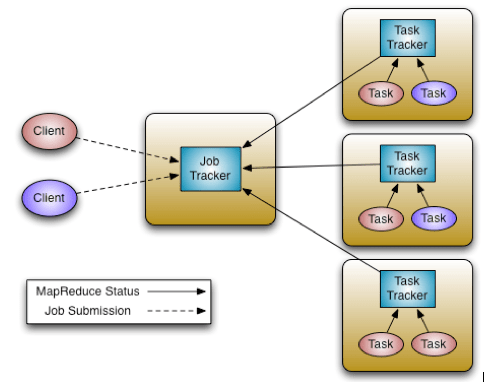
Hadoop1A master process called the JobTracker is the central scheduler for all MapReduce jobs in the cluster.

Nodes have a TaskTracker process that manages tasks on the individual nodes. The TaskTrackers, communicate with and are controlled by the JobTracker. Similar to most resource managers, the JobTracker has two pluggable scheduler modules, Capacity and Fair.

The JobTracker is responsible for managing the TaskTrackers on worker server nodes, tracking resource consumption and availability, scheduling individual job tasks, tracking progress, and providing fault tolerance for tasks.

The TaskTracker is directed by the JobTracker and is responsible for launch and tear down of jobs and provides task status information to the JobTracker.

The TaskTrackers also communicate through heartbeats to the JobTracker: If the JobTracker does not receive a heartbeat from a TaskTracker, it assumes it has failed and takes appropriate action (e.g., restarts jobs).

Hadoop 2 (YARN):

hadoop2

In YARN, the job tracker is split into two different daemons called ResourceManager and NodeManager (node specific).

Also there are new components: an ApplicationMaster and application Containers.

The ResourceManager is a pure scheduler. Its sole purpose is to manage available resources among multiple applications on the cluster. As with version 1, both Fair and Capacity scheduling options are available.

The ApplicationMaster is responsible for accepting job submissions, negotiating resource Containers from the ResourceManager, and tracking progress.

ApplicationMasters are specific to and written for each type of application. For example, YARN includes a distributed Shell framework that runs a shell script on multiple nodes on the cluster. The ApplicationMaster also provides the service for restarting the ApplicationMaster Container on failure.

ApplicationMasters request and manage Containers, which grant rights to an application to use a specific amount of resources (memory, CPU, etc.) on a specific host.

The ApplicationMaster, once given resources by the ResourceManager, contacts the NodeManager to start individual tasks. For example, using the MapReduce framework, these tasks would be mapper and reducer processes.

The NodeManager is the per-machine framework agent that is responsible for Containers, monitoring their resource usage (CPU, memory, disk, network), and reporting back to the ResourceManager.

On previous figure we have two ApplicationMasters running within the cluster, one of which has three Containers (the red client) and one that has one Container (the blue client). Note that the ApplicationMasters run on cluster nodes and not as part of the ResourceManager, thus reducing the pressure on a central scheduler. Also, because ApplicationMasters have dynamic control of Containers, cluster utilization can be improved.

Facts:

– Hadoop 2 has the concept of containers, while Hadoop 1 has slots. Containers are generic and can run any type of tasks, but a slot can run either a map or a reduce task.

– The same MR program without any modifications can be executed in Hadoop 1 and 2, but needs to be compiled with the appropriate set of jar files.

– Hadoop 1 allows us to write programs in only MR, while Hadoop 2 with  resource management framework (YARN) allows to write programs in multiple distributed computing models.  As example MR, Spark, Hama, Giraph, MPI and HBase coprocessors, among others.

Adding a JAR path to Hadoop classpath


This is simple, but it is a frequent question:

If we need to add some specific path pointing to a thirdparty library we can run a command like the following:

$ export HADOOP_CLASSPATH=$HADOOP_CLASSPATH:/home/hadoop/.versions/Cascading-2.5-SDK/binary/cascading/*:/home/hadoop/.versions/Cascading-2.5-SDK/binary/cascading/lib/cascading-core/*

Here I am adding two directories to the hadoop classpath:

/home/hadoop/.versions/Cascading-2.5-SDK/binary/cascading/*
/home/hadoop/.versions/Cascading-2.5-SDK/binary/cascading/lib/cascading-core/*

We can check the hadoop classpath with the following command:

$ hadoop classpath


Apache Hive: dealing with Out of Memory and Garbage Collector errors.


hive_logo

This is the common error:

java.lang.OutOfMemoryError: GC overhead limit exceeded

This error will occur in several Java environments, but, in particular, with Hive, is pretty common when big structures or several thousands objects are stored in memory.

According to Sun, the error will raise if too much time is being spent in garbage collection:

If more than 98% of the total time is spent in garbage collection and less than 2% of the heap is recovered, an OutOfMemoryError will be thrown.

This feature is designed to prevent applications from running for an extended period of time while making little or no progress because the heap is too small.

If necessary, this feature can be disabled by adding the option -XX:-UseGCOverheadLimit.

Also, we can increase the Heap Size, via “-Xmx1024m” option.

Another interesting option is the Concurrent Collector “UseConcMarkSweepGC“: It performs most of its work concurrently (i.e., while the application is still running) to keep garbage collection pauses short.

It is designed for applications with medium to large-sized data sets for which response time is more important than overall throughput, since the techniques used to minimize pauses can reduce application performance.

In Hive, we can set thes parameters with a  command like this:

SET mapred.child.java.opts="-server -Xmx1g -XX:+UseConcMarkSweepGC -XX:-UseGCOverheadLimit";


An alternative to avoid storing all the structure in memory:

Write intermediate results to a temporary table in the database instead of hashmaps, a database table table is not memory bound, so use an indexed table is a solution in many cases.

When the intermediate table is complete, execute a sql statement(s) from it instead of from memory.

HBase Basics


NoSQL?

HBase is a type of “NoSQL” database. “NoSQL” is a general term meaning that the database isn’t an RDBMS which supports SQL as its primary access language, but there are many types of NoSQL databases: BerkeleyDB is an example of a local NoSQL database, whereas HBase is very much a distributed database.

Technically speaking, HBase is really more a “Data Store” than “Data Base” because it lacks many of the features you find in an RDBMS, such as typed columns, secondary indexes, triggers, and advanced query languages, etc.

However, HBase has many features which supports both linear and modular scaling. HBase clusters expand by adding RegionServers that are hosted on commodity class servers. If a cluster expands from 10 to 20 RegionServers, for example, it doubles both in terms of storage and as well as processing capacity. RDBMS can scale well, but only up to a point – specifically, the size of a single database server – and for the best performance requires specialized hardware and storage devices. HBase features of note are:

  • Strongly consistent reads/writes: HBase is not an “eventually consistent” DataStore. This makes it very suitable for tasks such as high-speed counter aggregation.
  • Automatic sharding: HBase tables are distributed on the cluster via regions, and regions are automatically split and re-distributed as your data grows.
  • Automatic RegionServer failover
  • Hadoop/HDFS Integration: HBase supports HDFS out of the box as its distributed file system.
  • MapReduce: HBase supports massively parallelized processing via MapReduce for using HBase as both source and sink.
  • Java Client API: HBase supports an easy to use Java API for programmatic access.
  • Thrift/REST API: HBase also supports Thrift and REST for non-Java front-ends.
  • Block Cache and Bloom Filters: HBase supports a Block Cache and Bloom Filters for high volume query optimization.
  • Operational Management: HBase provides build-in web-pages for operational insight as well as JMX metrics.

When Should I Use HBase?

HBase isn’t suitable for every problem.

1) Make sure you have enough data. If you have hundreds of millions or billions of rows, then HBase is a good candidate. If you only have a few thousand/million rows, then using a traditional RDBMS might be a better choice due to the fact that all of your data might wind up on a single node (or two) and the rest of the cluster may be sitting idle.

2) Make sure you can live without all the extra features that an RDBMS provides (e.g., typed columns, secondary indexes, transactions, advanced query languages, etc.)

An application built against an RDBMS cannot be “ported” to HBase by simply changing a JDBC driver, for example. Consider moving from an RDBMS to HBase as a complete redesign as opposed to a port.

3) Make sure you have enough hardware. Even HDFS doesn’t do well with anything less than 5 DataNodes (due to things such as HDFS block replication which has a default of 3), plus a NameNode.

HBase can run quite well stand-alone on a laptop – but this should be considered a development configuration only.

How does HBase distribute the data across the cluster ?

HBase stores rows of data in tables. Tables are split into chunks of rows called “regions”. Those regions are distributed across the cluster, hosted and made available to client processes by the RegionServer process.

hbase-architectureA region is a continuous range within the key space, meaning all rows in the table that sort between the region’s start key and end key are stored in the same region. Regions are non-overlapping, i.e. a single row key belongs to exactly one region at any point in time. A region is only served by a single region server at any point in time, which is how HBase guarantees strong consistency within a single row#. Together with the -ROOT- and .META. regions, a table’s regions effectively form a 3 level B-Tree for the purposes of locating a row within a table.

HBase depends on HDFS for data storage. RegionServers collocate with the HDFS DataNodes. This enables data locality for the data served by the RegionServers, at least in the common case. Region assignment, DDL operations, and other book-keeping facilities are handled by the HBase Master process.

hbase-physical-architectureIt uses Zookeeper to maintain live cluster state. When accessing data, clients communicate with HBase RegionServers directly. That way, Zookeeper and the Master process don’t bottle-neck data throughput. No persistent state lives in Zookeeper or the Master. HBase is designed to recover from complete failure entirely from data persisted durably to HDFS.

What Is The Difference Between HBase and Hadoop/HDFS?

HDFS is a distributed file system that is well suited for the storage of large files. Its documentation states that it is not, however, a general purpose file system, and does not provide fast individual record lookups in files. HBase, on the other hand, is built on top of HDFS and provides fast record lookups (and updates) for large tables. This can sometimes be a point of conceptual confusion. HBase internally puts your data in indexed “StoreFiles” that exist on HDFS for high-speed lookups.

More info:

http://hbase.apache.org/book/book.html

http://hortonworks.com/blog/apache-hbase-region-splitting-and-merging/