Flush DNS on Mac


Making DNS changes and wanting to force a flush on a Mac?

Here are the commands for the different mac versions:

MacOS VersionCommand
macOS 12 (Monterey)sudo dscacheutil -flushcache; sudo killall -HUP mDNSResponder
macOS 11 (Big Sur)sudo dscacheutil -flushcache; sudo killall -HUP mDNSResponder
macOS 10.15 (Catalina)sudo dscacheutil -flushcache; sudo killall -HUP mDNSResponder
macOS 10.14 (Mojave)sudo killall -HUP mDNSResponder
macOS 10.13 (High Sierra)sudo killall -HUP mDNSResponder
macOS 10.12 (Sierra)sudo killall -HUP mDNSResponder
OS X 10.11 (El Capitan)sudo killall -HUP mDNSResponder
OS X 10.10 (Yosemite)sudo discoveryutil udnsflushcaches
OS X 10.9 (Mavericks)sudo killall -HUP mDNSResponder
OS X 10.8 (Mountain Lion)sudo killall -HUP mDNSResponder
Mac OS X 10.7 (Lion)sudo killall -HUP mDNSResponder
Mac OS X 10.6 (Snow Leopard)sudo dscacheutil -flushcache
Mac OS X 10.5 (Leopard)sudo lookupd -flushcache
Mac OS X 10.4 (Tiger)lookupd -flushcache

Emacs on MAC OS X


Installing Emacs

Get Homebrew, then, in the terminal, install emacs-plus:

brew install d12frosted/emacs-plus/emacs-plus@28 

Link to emacs in “/Applications” with:

rm -rf /Applications/Emacs.app && ln -s /usr/local/opt/emacs-plus@28/Emacs.app /Applications

Emacs For the Dummies

To run emacs, just type:

   emacs filename

where filename is the file you want to edit.

On PowerPC desktop or any workstations with X windows, you may want to put the emacs session into background so that you can still use the current xterm window, just type

   emacs filename &

Once you are in emacs, the top menu bars offer the four sub-menus:

   Buffer   File   Edit    Help

The sub-menu Buffer allows you to switch between different files that you are editing. The sub-menu File contains commands on how to open another file, save files, exit emacs, etc. For example, to open a new file, just click the File button and the Open File… option, the cursor will then jump to the minibuffer at the bottom of the screen; you can type in the file name, the one which you want to open, and type the “return” key.

Alternatively (preferred by most people), you can use the key bindings to do most of these and more.

Use the arrow keys to move the cursor

C-x C-f         open a new file
C-x C-s         save the current file
C-x C-c         exit the emacs (but save files first)

Here, the prefix C- refers to the CONTROL key, the prefix ESC- refers to the ESCAPE pkey. For example, C-x means to simultaneously press the CONTROL key and the “x” key.


Key Bindings

In the following, the prefix C- refers to the CONTROL key, the prefix ESC- refers to the ESCAPE key. For example, C-n means to simultaneously press the CONTROL key and the key “n”. Lines

C-a             go to the beginning-of-line
C-e             go to the end-of-line
C-n             go to next-line
C-p             go to previous-line
C-k             kill the current line
C-o             open-line

The following two bindings are CS210 specific:

  C-x C-g         go to a specific line numbered x 
  C-x C-w         show (in the minibuffer ) the current line number

Words

ESC f           forward-word
ESC b           backward-word
ESC d           kill-word
ESC DEL         backward-kill-word

Characters

C-f             forward-char
C-b             backward-char
C-d             delete-char
DEL             delete-backward-char
C-q             quoted-insert
C-t             transpose-chars

Regions

C-space         set a region mark
C-w             kill-region (between cursor and mark)
ESC-w           memorize the contents of the region (without kill)
C-y             yank (i.e., insert text last killed or memorize)

Screen control

C-l             recenter
C-v             scroll-up (forward)
ESC-v           scroll-down (backward)
ESC <           beginning-of-buffer
ESC >           end-of-buffer

Search

C-s             isearch-forward
C-r             isearch-backward

Files

C-x C-f         find-file
C-x C-r         find-file-read-only
C-x C-s         save-current-file

Windows

C-x 1           delete-other-windows
C-x 2           split-window-vertically
C-x 4 f         find-file-other-window
C-x o           other-window

Command execution

ESC !           shell-command
ESC x compile   compile ("make -k" is default)
C-x `           next-error
                (used after "compile" to find/edit errors)

Miscellaneous

C-x C-c         save-buffers-kill-emacs
C-u             universal-argument
C-x C-z         suspend-emacs
                (resume by typing "fg" to unix)

Help!

C-g             keyboard-quit
C-h             help-command
C-h t           help-with-tutorial
C-h b           describe-bindings
                (complete list of emacs commands)

Commands for Compiling

ESC-x compile

Runs the compiler, linker, etc.

If this is the first time you have issued this command since entering emacs, the minibuffer at the bottom of the screen appears filled with make -k. If you’re not using make -k erase the minibuffer line (e.g., using DEL) and type in the compiler command of your choice, e.g., gccx hello.c. This command is remembered for subsequent executions of ESC-x compile. When you type RETURN, if there are unsaved buffers, you will be given the opportunity to save each one. The screen then splits into two windows, and the output from the compilation command appears in one of the two windows. If there are parse errors, use the following command.

C-x `

Finds the locations of errors. Each time this command is given after a compilation that found errors, another line of parse errors is located. The compilation window is scrolled up, so that the topmost line displays the a new parse error. The other window changes buffers, if necessary, and displays the source line associated with the error. Note that if your program consists of several files, this command locates the file and loads it into the buffer. The cursor is placed at the line containing the error. You may edit the file to correct the source of the error and repeat the command again to find additional errors. When you have done the most you can with this batch of parse errors, give the ESC-x compile command again.


Commands for Debugging

ESC-x gdb

Runs gdb, the GNU interactive debugger.

The minibuffer at the bottom of the screen prompts you for the name of your executable file. Unless you compiled with the -o option to name the output file, the name of your executable file is a.out. When you type in the file name followed by RETURN, the screen splits into two windows (or remain split if it is split already). One window is used for interactive input and output to gdb. The other will eventually display your program files for you to examine and edit. Sometimes the screen doesn’t divide immediately after ESC-x gdb, but gdb takes over the whole window where it was executed from; the screen divides the first time you run the program and it stops because of a breakpoint or an error caught by the debugger. So, if the window doesn’t split and you want to follow the behaviour of the running program, just type break main before you run it the first time. When execution reaches main, the window splits as described above, an arrow points to the current position in the code, which is the first line of main.

The cursor initially is placed after the gdb prompt (gdb). Whenever you want to issue a command to gdb, position the cursor at the end of the buffer, i.e., after the (gdb), and type the command as usual. The command ESC-> gets you to the end of the buffer. To examine previous input or output to gdb, use the usual emacs commands to move around the buffer.

Whenever your program, which was running under gdb, stops because of a breakpoint an interrupt, etc., the source code associated with the current locus of execution is displayed automatically in the other window. A marker, =>, points to the specific line. If you use the frame command to change frames, the source for the new frame is displayed and the marker is placed accordingly.

When you find an error, you may change the source code and save the file. However, before recompiling, give gdb the command kill to cancel your running program. Otherwise, when the compiler runs the linker to link your program you’ll get the error `text file busy’ and a new executable file will not be written.

After recompiling a program, you should reload the symbol table and the executable, otherwise you’ll be running the previous program. To do so, execute

(gdb) exec-file program-name

(gdb) symbol-file program-name

The symbol-file command will request confirmation before reloading the symbol table; just answer yes.

ESC-x gdb-break

Sets a gdb breakpoint at the source line on which the cursor appears.

Commands for Controlling Windows

Windows in emacs usually refer to subdivisions.

C-x 1

Reformats screen into one window, retaining only the window in which the cursor appears.

C-x 4 f

Finds a file and displays it in the other window (the window in which the cursor does not appear). If the screen has only one window, split it into two. The C-x 4f command prompts for the file name.

C-x o

Moves the cursor to another window.

Windows in the usual sense are called frames in emacs. You can use frames only if you are using PowerPC desktops or any workstations with X window systems. Frames give you true separate emacs windows at the same time. Clearly, you can not use frames if you are using a text-based terminal (e.g., via remote telnet or remote login).

C-x 5 2

Creates a new frame.

C-x 5 f

Finds a file and displays it in the other frame (the frame in which the cursor does not appear).

C-x 5 0

Deletes the selected frame. This is not allowed if there is only one frame.

Cua-Mode

Cua-mode is part of GnuEmacs versions 22.1.1 and later (at least).Cua-mode allows one to use ‘C-v’, ‘C-c’, and ‘C-x’ to paste, copy, and cut the region.

List AWS Security Groups open to 0.0.0.0/0


We all now that opening security groups to the world is a bad practice, right? Maybe we can audit these running some queries like the following:

Inbound:

$ aws ec2 –region us-west-2 describe-security-groups –filter Name=ip-permission.cidr,Values=’0.0.0.0/0′ –query “SecurityGroups[*].{Name:GroupName,ID:GroupId}” –output table

| DescribeSecurityGroups |
+-----------------------+-------------------+
| ID | Name |
+-----------------------+-------------------+
| sg-0b977c7003c7b280 | launch-wizard-2 |
+-----------------------+-------------------+

Outbound:

$ aws ec2 –region us-west-2 describe-security-groups –filter Name=egress.ip-permission.cidr,Values=’0.0.0.0/0′ –query “SecurityGroups[*].{Name:GroupName,ID:GroupId}” –output table

| DescribeSecurityGroups |
+-----------------------+-------------------------------------------------+
| ID | Name |
+-----------------------+-------------------------------------------------+
| sg-61de04 | vivXXXX_XX_US_West |
| sg-9eefe3 | CentOS 6  |
| sg-9479a0 | default |
| sg-e6b0a4 | ElasticMapReduce-master |
| sg-077c79703c7b280 | launch-wizard-2 |
| sg-b24375 | default |
+-----------------------+-------------------------------------------------+

The good old SAR


Quick reference of this noble and old school command.

Very useful for troubleshooting and server performance.

Checking CPU Activity

By default, sar command will report the CPU activity of the server. The option -u can be used to get the CPU utilization report.

To get the CPU activity report in every 2 seconds for 3 times:

$ sar -u 2 3

Linux 3.10.0-1127.10.1.el7.x86_64 (localhost.localdomain) 	09/06/2020 	_x86_64_	(2 CPU)

22:26:54        CPU     %user     %nice   %system   %iowait    %steal     %idle
22:26:56        all      4,03      0,00      0,50      0,00      0,00     95,47
22:26:58        all      8,08      0,00      0,51      0,00      0,00     91,41
22:27:00        all     12,50      0,00      1,00      0,00      0,00     86,50
Average:        all      8,21      0,00      0,67      0,00      0,00     91,11

CPU usage for each processor

To find the CPU activity on all processors separately, you need to use the -P option.

$ sar -P ALL 1 1

Linux 3.10.0-1127.10.1.el7.x86_64 (localhost.localdomain) 	10/06/2020 	_x86_64_	(2 CPU)

05:38:18        CPU     %user     %nice   %system   %iowait    %steal     %idle
05:38:19        all      3,03      0,00      0,00      0,00      0,00     96,97
05:38:19          0      3,96      0,00      0,99      0,00      0,00     95,05
05:38:19          1      3,00      0,00      0,00      0,00      0,00     97,00

Average:        CPU     %user     %nice   %system   %iowait    %steal     %idle
Average:        all      3,03      0,00      0,00      0,00      0,00     96,97
Average:          0      3,96      0,00      0,99      0,00      0,00     95,05
Average:          1      3,00      0,00      0,00      0,00      0,00     97,00

Check Memory usage

To find the memory usage (used and free memory of the server) over time using the -r switch.

$ sar -r 1 3

Linux 3.10.0-1127.10.1.el7.x86_64 (localhost.localdomain) 	10/06/2020 	_x86_64_	(2 CPU)

05:41:04    kbmemfree kbmemused  %memused kbbuffers  kbcached  kbcommit   %commit  kbactive   kbinact   kbdirty
05:41:05       855300   3025220     77,96         0   1495276   2426864     30,55   1265008   1158172       100
05:41:06       854800   3025720     77,97         0   1495276   2426864     30,55   1265132   1158172       100
05:41:07       855032   3025488     77,97         0   1495276   2426864     30,55   1265012   1158172       100
Average:       855044   3025476     77,97         0   1495276   2426864     30,55   1265051   1158172       100

Check Swap Activity

Check the swap usage of the machine using the -W option:

$ sar -W 1 3
Linux 2.6.18-274.18.1.el5 (myserver) 09/06/2012
03:31:12 PM pswpin/s pswpout/s
03:31:13 PM 16.16 0.00
03:31:14 PM 16.00 0.00
03:31:15 PM 15.84 0.00
Average: 16.00 0.00

Find load averages over time

You can find the load averages overtime using the -q option:

$ sar -q 1 3

Linux 3.10.0-1127.10.1.el7.x86_64 (localhost.localdomain) 	10/06/2020 	_x86_64_	(2 CPU)

06:16:13      runq-sz  plist-sz   ldavg-1   ldavg-5  ldavg-15   blocked
06:16:14            0       329      0,00      0,04      0,09         0
06:16:15            0       329      0,00      0,04      0,09         0
06:16:16            0       329      0,00      0,04      0,09         0
Average:            0       329      0,00      0,04      0,09         0

Statistics for currently mounted filesystems

$ sar -F 2 3

Linux 3.10.0-1127.10.1.el7.x86_64 (localhost.localdomain) 	10/06/2020 	_x86_64_	(2 CPU)

06:30:18     MBfsfree  MBfsused   %fsused  %ufsused     Ifree     Iused    %Iused FILESYSTEM
06:30:20        30410      5532     15,39     15,39  18245113    166407      0,90 /dev/mapper/centos-root
06:30:20          796       218     21,52     21,52    523947       341      0,07 /dev/sda1

06:30:20     MBfsfree  MBfsused   %fsused  %ufsused     Ifree     Iused    %Iused FILESYSTEM
06:30:22        30410      5532     15,39     15,39  18245113    166407      0,90 /dev/mapper/centos-root
06:30:22          796       218     21,52     21,52    523947       341      0,07 /dev/sda1

06:30:22     MBfsfree  MBfsused   %fsused  %ufsused     Ifree     Iused    %Iused FILESYSTEM
06:30:24        30410      5532     15,39     15,39  18245113    166407      0,90 /dev/mapper/centos-root
06:30:24          796       218     21,52     21,52    523947       341      0,07 /dev/sda1

Summary:     MBfsfree  MBfsused   %fsused  %ufsused     Ifree     Iused    %Iused FILESYSTEM
Summary         30410      5532     15,39     15,39  18245113    166407      0,90 /dev/mapper/centos-root
Summary           796       218     21,52     21,52    523947       341      0,07 /dev/sda1

Details of inode, kernel tables and file tables

$ sar -v 2 3

Linux 3.10.0-1127.10.1.el7.x86_64 (localhost.localdomain) 	10/06/2020 	_x86_64_	(2 CPU)

06:57:23    dentunusd   file-nr  inode-nr    pty-nr
06:57:25       160833      2400    132081         3
06:57:27       160833      2400    132081         3
06:57:29       160833      2400    132081         3
Average:       160833      2400    132081         3

Network statistics

$ sar -n DEV

Linux 3.10.0-1127.10.1.el7.x86_64 (localhost.localdomain) 	10/06/2020 	_x86_64_	(2 CPU)

19:20:23        IFACE   rxpck/s   txpck/s    rxkB/s    txkB/s   rxcmp/s   txcmp/s  rxmcst/s
19:20:24       ens192     11,00      4,00      1,80      2,75      0,00      0,00      0,00
19:20:24           lo     79,00     79,00     43,62     43,62      0,00      0,00      0,00

Average:        IFACE   rxpck/s   txpck/s    rxkB/s    txkB/s   rxcmp/s   txcmp/s  rxmcst/s
Average:       ens192     11,00      4,00      1,80      2,75      0,00      0,00      0,00
Average:           lo     79,00     79,00     43,62     43,62      0,00      0,00  

Which interrupt number could be causing a CPU bottleneck?

$ sar -I XALL 2 10
02:07:10 AM INTR intr/s
02:07:12 AM 0 992.57
02:07:12 AM 1 0.00
02:07:12 AM 2 0.00
02:07:12 AM 3 0.00
02:07:12 AM 4 0.00
02:07:12 AM 5 0.00
02:07:12 AM 6 0.00
02:07:12 AM 7 0.00
02:07:12 AM 8 0.00
02:07:12 AM 9 350.50

‘/proc/interrupts’ file will also provide helpful information. Interrupt halts CPU processing so that I/O or other operations can occur. Processing resumes after the specific operation takes place. It is very important that each device installed in machine is provided with an interrupt setting that does not conflict with the settings used by the hardware and other devices.

$ sudo cat /proc/interrupts

           CPU0       CPU1       
  0:         48          0   IO-APIC-edge      timer
  1:         54          0   IO-APIC-edge      i8042
  8:          1          0   IO-APIC-edge      rtc0
  9:          0          0   IO-APIC-fasteoi   acpi
 12:         35        116   IO-APIC-edge      i8042
 14:          0          0   IO-APIC-edge      ata_piix
 15:          0          0   IO-APIC-edge      ata_piix
 16:        118       2513   IO-APIC-fasteoi   vmwgfx
 24:          0          0   PCI-MSI-edge      PCIe PME, pciehp
 25:          0          0   PCI-MSI-edge      PCIe PME, pciehp
 26:          0          0   PCI-MSI-edge      PCIe PME, pciehp
 27:          0          0   PCI-MSI-edge      PCIe PME, pciehp
NMI:          0          0   Non-maskable interrupts
LOC:   35392807   14792833   Local timer interrupts
SPU:          0          0   Spurious interrupts
PMI:          0          0   Performance monitoring interrupts
IWI:    2677624     215297   IRQ work interrupts

Linux Kernel Tuning: page allocation failure


If you start seeing these errors it means your server or instance started running out of kernel memory.

[10223.291166] java: page allocation failure: order:0, mode:0x1080020(GFP_ATOMIC), nodemask=(null)
[10223.301794] java cpuset=/ mems_allowed=0-1
[10223.307211] CPU: 29 PID: 19395 Comm: java Not tainted 4.14.154-99.181.amzn1.x86_64 #1
[10223.315658] Hardware name: Xen HVM domU, BIOS 4.2.amazon 08/24/2006
[10223.322004] Call Trace:
[10223.325230]  <IRQ>
[10223.328193]  dump_stack+0x66/0x82
[10223.332213]  warn_alloc+0xe0/0x180

In particular, these Order 0 (zero) errors, mean there isn’t even a single 4K page available to allocate.

This might sound weird on a system were we have a lot of RAM memory available. And actually, this may be a common situation on systems where the kernel is not tuned up properly.

In particular, we need to look at the following kernel parameter:

min_free_kbytes:

This is used to force the Linux VM to keep a minimum number
of kilobytes free.  The VM uses this number to compute a
watermark[WMARK_MIN] value for each lowmem zOn one in the system.
Each lowmem zone gets a number of reserved free pages based
proportionally on its size.

Some minimal amount of memory is needed to satisfy PF_MEMALLOC
allocations; if you set this to lower than 1024KB, your system will
become subtly broken, and prone to deadlock under high loads.

Setting this too high will OOM your machine instantly.

On systems with very large amount of RAM memory, this parameter is usually set too low. Change default value (have a look to the previous paragraph to avoid too low or too high values) and restart with sysctl. 1GB is the value I use on most of the large memory servers (64GB+).

sudo sed -i '${s/$/'"\nvm.min_free_kbytes = 1048576"'/}' /etc/sysctl.conf
sysctl vm.min_free_kbytes

echo "reloading the settings:"
sudo /sbin/sysctl -p

EBS Storage Performance Notes – Instance throughput vs Volume throughput


I just wanted to write a couple lines/guidance on this regard as this is a recurring question when configuring storage, not only in the cloud, but can also happen on bare metal servers.

What is throughput on a volume?

Throughput is the measure of the amount of data transferred from/to a storage device per time unit (typically seconds).

The throughput consumed on a volume is calculated using this formula:

IOPS (IO Ops per second) x BS (block size)= Throughput

As example, if we are writing at 1200 Ops/Sec, and the chunk write size is around 125Kb, we will have a total throughput of about 150Mb/sec.

Why is this important?

This is important because we have to be aware of the Maximum Total Throughput Capacity for a specific volume vs the Maximum Total Instance Throughput.

Because, if your instance type (or server) is able to produce a throughput of 1250MiB/s (i.e M4.16xl)) and your EBS Maximum Throughput is 500MiB/s (i.e. ST1), not only you will hit a bottleneck trying to write to the specific volumes, but also throttling might occur (i.e. EBS on cloud services).

How do I find what is the Maximum throughput for EC2 instances and EBS volumes?

Here is documentation about Maximum Instance Throughput for every instance type on EC2: https://docs.aws.amazon.com/AWSEC2/latest/UserGuide/ebs-optimized.html

And here about the EBS Maximum Volume throughput: https://docs.aws.amazon.com/AWSEC2/latest/UserGuide/ebs-volume-types.html

How do I solve the problem ?

If we have an instance/server that has more throughput capabilities than the volume, just add or split the storage capacity into more volumes. So the load/throughput will be distributed across the volumes.

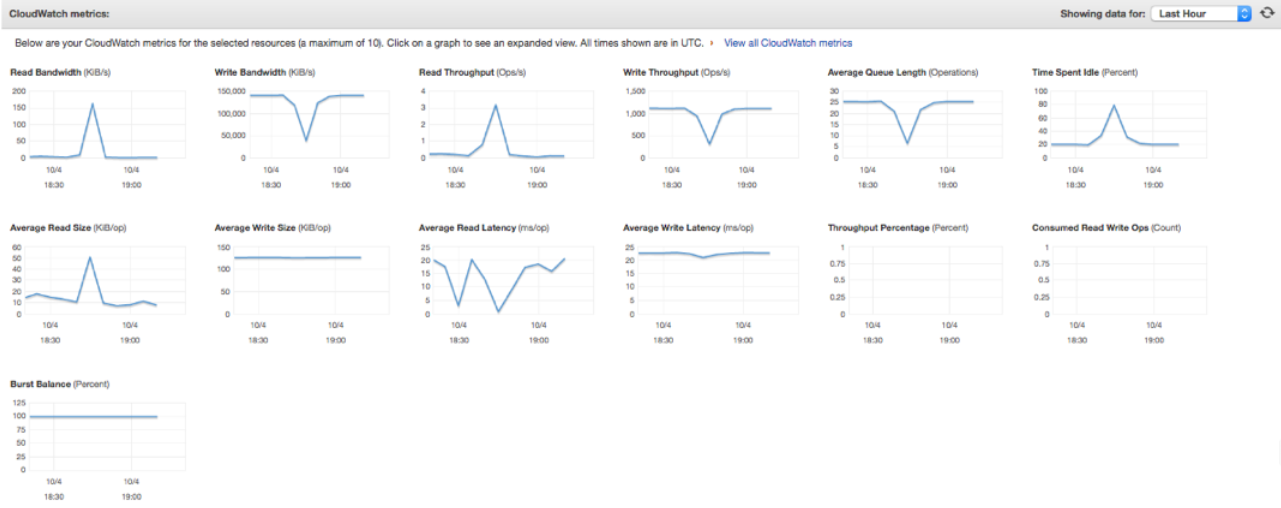
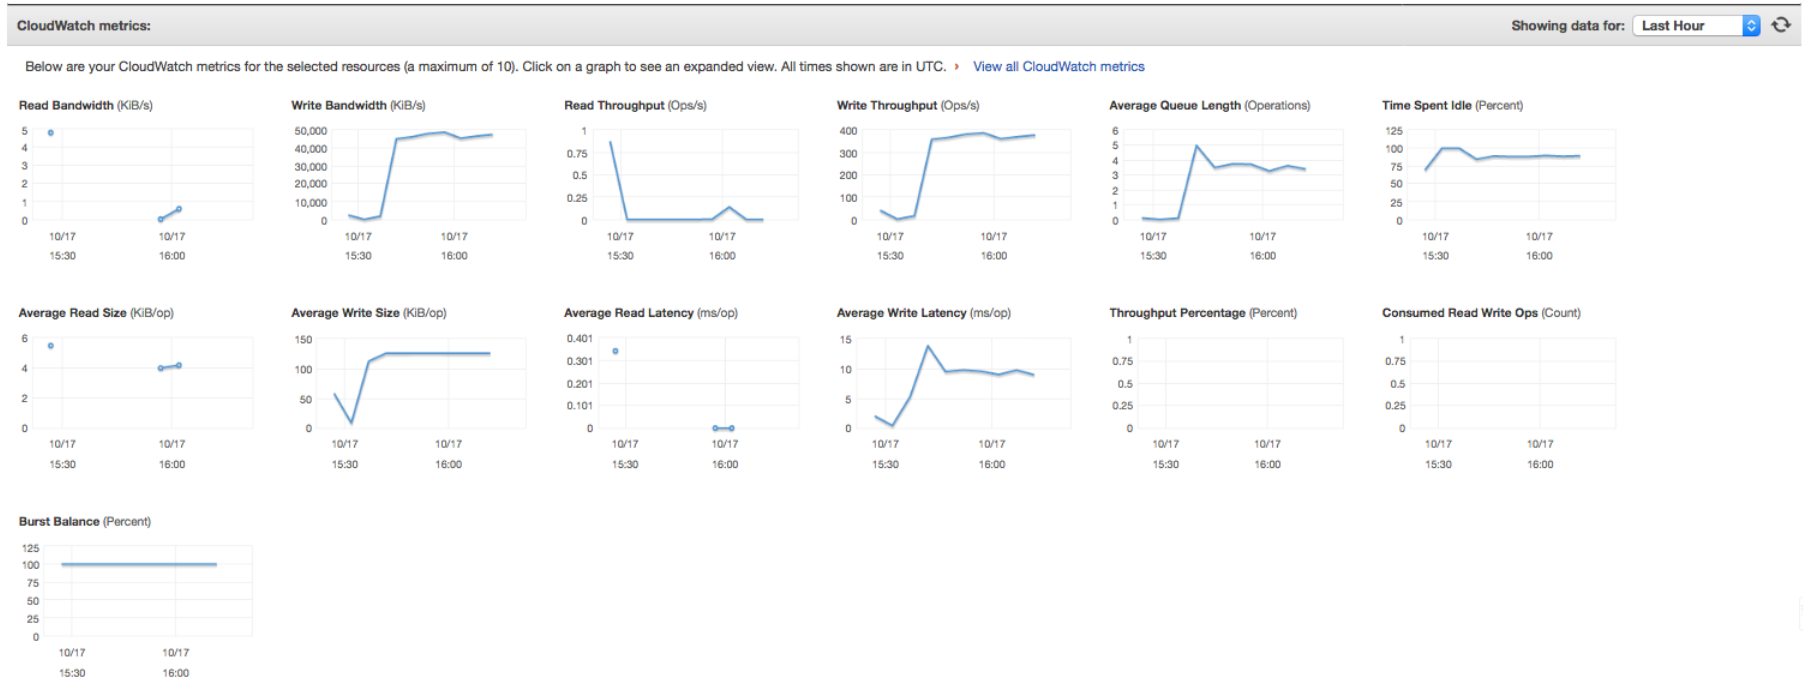
As an example, here are some metrics with different volume configurations:

1 x 3000GB – 9000IOPS volume:

GP2-1x3000GB-9000IOPS

3 x 1000GB – 3000IOPS volume:

GP2-3x1000GB-3000IOPS

Look at some of the metrics: these are using the same instance type (m4.10xl – 500Mb/s throughput), same volume type (GP2 – 160Mb/s throughput) and running the same job:

  • Using 1 volume, Write/Read Latency is around 20-25 ms/op. This value is high compared to 3x1000GB volumes.
  • Using 1 volume, Avg Queue length 25. The queue depth is the number of pending I/O requests from your application to your volume. For maximum consistency, a Provisioned IOPS volume must maintain an average queue depth (rounded to the nearest whole number) of one for every 500 provisioned IOPS in a minute. On this scenario 9000/500=18. Queue length of 18 or higher will be needed to reach 9000 IOPS.
  • Burst Balance is 100%, which is Ok, but if this balance drops to zero (it will happen if volume capacity keeps being exceeded), all the requests will be throttled and you’ll start seeing IO errors.
  • On both scenarios, Avg Write Size is pretty large (around 125KiB/op) which will typically cause the volume to hit the throughput limit before hitting the IOPS limit.
  • Using 1 volume, Write throughput is around 1200 Ops/Sec. Having write size around 125Kb, it will consume about 150Mb/sec. (IOPS x BS = Throughput)

log4j vulnerability – quick notes


This issue may lead to remote code execution (RCE) via use of JNDI.

  • Vendor: Apache Software Foundation
    • Product: Apache Log4j
      • <=2.14.1: affects 2.14.1 and prior versions

Fix: log4j 2.15.0

To list all JAR files on your system containing the vulnerable class file (including fat JARs), you can use:

for f in $(find . -name '*.jar' 2>/dev/null); do echo "Checking $f…"; unzip -l "$f" | grep -F org/apache/logging/log4j/core/lookup/JndiLookup.class; done

Additional details here:

https://www.cve.org/CVERecord?id=CVE-2021-44228

Linux Kernel Tuning: task blocked for more than 120 seconds


This might be old school, and maybe even boring reading. But, if you concern about performance on Linux servers, at some point, you will have to have a look to the kernel messages.

The problem:

When we run very stressful jobs running on large servers (large number of CPU’s and RAM memory), where IO activity is very high. It is pretty common to start seeing these messages on the ‘dmesg’ kernel output:

[24169.372862] INFO: task kswapd1:1140 blocked for more than 120 seconds.
[24169.375623] Tainted: G E 4.9.51-10.52.amzn1.x86_64 #1
[24169.378445] "echo 0 > /proc/sys/kernel/hung_task_timeout_secs" disables this message.
[24169.382533] kswapd1 D 0 1140 2 0x00000000
[24169.385066] ffff8811605c5a00 0000000000000000 ffff8823645dc900 ffff882362844900
[24169.389208] ffff882371357c00 ffffc9001a13ba08 ffffffff8153896c ffffc9001a13ba18
[24169.393329] ffff881163ac92d8 ffff88115e87f400 ffff882362844900 ffff88115e87f46c
[24169.445313] Call Trace:
[24169.446981] [<ffffffff8153896c>] ? __schedule+0x23c/0x680
[24169.449454] [<ffffffff81538de6>] schedule+0x36/0x80
[24169.451790] [<ffffffff8153907e>] schedule_preempt_disabled+0xe/0x10
[24169.454509] [<ffffffff8153a8d5>] __mutex_lock_slowpath+0x95/0x110
[24169.457156] [<ffffffff8153a967>] mutex_lock+0x17/0x27
[24169.459546] [<ffffffffa0966d00>] xfs_reclaim_inodes_ag+0x2b0/0x330 [xfs]
[24169.462407] [<ffffffffa0967be3>] xfs_reclaim_inodes_nr+0x33/0x40 [xfs]
[24169.465203] [<ffffffffa0978f59>] xfs_fs_free_cached_objects+0x19/0x20 [xfs]
...

Why is this happening?

This indicates that the process requested a block device such as a disk/swap, and wasn’t able to be fulfilled for more than 120 seconds and subsequently abandoned by the kernel.

As mentioned before, the probability of observing this behavior will increase when we use instances with large number of vCores (e.g. 64+ vCores), given that the volume of IO requests could be higher, and, the kernel buffer queues not configured for such load.

This is also very common on clustered environments. Even though the framework will retry, on Hadoop/YARN environments, this will impact in performance, and, might also lead to application failures.

The Solution:

To solve this problem, we have to increase the ‘dirty_background_bytes‘ kernel setting  to higher values to be able to accommodate the throughput.

As a base formula, we usually consider a value of dirty_background_bytes=10MB for 40MB/Sec throughput.

The goal is to have the page cache to allow the OS to write asynchronously to disk whenever possible. Otherwise, when the write becomes synchronous, it would involve a waiting time.

Additionally to the dirty_background_bytes kernel parameter, we can also set:

  • dirty_background_ratio = 10 (represents the percentage of system memory which when dirty then system can start writing data to the disks. When the dirty pages exceed ratio 10, I/O starts, i.e they start getting flushed / written to the disk)
  • dirty_ratio = 15 (is percentage of system memory which when dirty, the process doing writes would block and write out dirty pages to the disks. When total number of dirty pages exceed ratio 15, all writes get blocked until some of the dirty pages get written to disk. This is like an upper limit)

We try to keep these two values low to avoid  I/O bottlenecks. We can experiment setting both down to zero, to force fast flushes on high stress environments.

Another parameter we can use is dirty_bytes, which represents the amount of dirty memory at which a process generating disk writes will itself start writeback. We should set dirty_ratio = 0 if we set dirty_bytes, as only one of these might be specified at a time.

e.g.

dirty_bytes = 2147483648

More details on these parameters is available here.

Linux Kernel Tuning: failed to alloc buffer for rx queue


If we put enough pressure over the ENA network driver, we’ll start seeing these “failed to alloc buffer for rx queue” messages on the ‘dmesg‘ output.

[56459.833033] ena 0000:00:05.0 eth0: failed to alloc buffer for rx queue 4
[56459.836477] ena 0000:00:05.0 eth0: refilled rx qid 4 with only 85 buffers (from 168)

This message will raise when the napi handler fails to refill new Rx descriptors, typically due to lack of memory. This situation might lead to performance decrease, given that some requests would have to be rescheduled. 

The code handling these situations can be found here.

The solution for this is related to a memory increase on “min_free_kbytes” kernel parameter. As example:

vm.min_free_kbytes = 1048576

Place the following commands in /etc/sysctl.conf. And load the new setting with:

sysctl -p

It is recommended to have at least 512MB, with a minimum of 128MB for constrained environment. On large instance types running stress jobs (e.g. 64+ vCores + 256GiB + RAM), this value can typically be set to 10MB.


Listen on a port/Send data to a port


Listening with nc:

nc -l 8089

Checking that 8089 port is listening:

netstat -nap|grep 8089
(Not all processes could be identified, non-owned process info
will not be shown, you would have to be root to see it all.)
tcp 0 0 0.0.0.0:8089 0.0.0.0:* LISTEN 27543/nc
tcp 0 0 127.0.0.1:8089 127.0.0.1:43592 TIME_WAIT -

Sending data to 8089 port:

telnet localhost 8089
Trying 127.0.0.1...
Connected to localhost.localdomain (127.0.0.1).
Escape character is '^]'.
hello


listeningOnAPort_SendingDataToAPort