Consider boosting spark.yarn.executor.memoryOverhead


This is a very specific error related to the Spark Executor and the YARN container coexistence.

You will typically see errors like this one on the application container logs:

15/03/12 18:53:46 WARN YarnAllocator: Container killed by YARN for exceeding memory limits. 9.3 GB of 9.3 GB physical memory used. Consider boosting spark.yarn.executor.memoryOverhead.
15/03/12 18:53:46 ERROR YarnClusterScheduler: Lost executor 21 on ip-xxx-xx-xx-xx: Container killed by YARN for exceeding memory limits. 9.3 GB of 9.3 GB physical memory used. Consider boosting spark.yarn.executor.memoryOverhead.

To overcome this, you need to keep in mind how Yarn container and the executor are set in memory:

spark-tuning-yarn-memory

Memory used by Spark Executor is exceeding the predefined limits (often caused by a few spikes) and that is causing YARN to kill the container with the previously mentioned message error.

By default ‘spark.yarn.executor.memoryOverhead’ parameter is set to 384 MB. This value could be low depending on your application and the data load.

Suggested value for this parameter is ‘executorMemory * 0.10’.

We can increase the value for ‘spark.yarn.executor.memoryOverhead’ to 1GB on spark-submit bu adding this to the command line:

–conf spark.yarn.executor.memoryOverhead=1024

For reference, this fix was added on Jira 1930:

+  <td><code>spark.yarn.executor.memoryOverhead</code></td>


Apache Spark – How it Works – Performance Notes


Apache Spark, is an open source cluster computing framework originally developed at University of California, Berkeley but was later donated to the Apache Software Foundation where it remains today. In contrast to Hadoop’s two-stage disk-based MapReduce paradigm, Spark’s multi-stage in-memory primitives provides performance up to 100 faster for certain applications.

RDD’s:

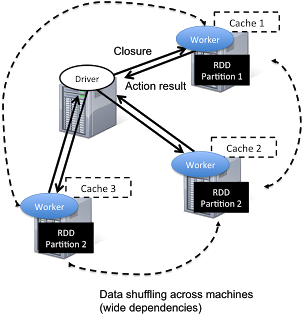
Spark has a driver program where the application logic execution is started, with multiple workers which processing data in parallel.
The data is typically collocated with the worker and partitioned across the same set of machines within the cluster.  During the execution, the driver program will pass the code/closure into the worker machine where processing of corresponding partition of data will be conducted.
The data will undergoing different steps of transformation while staying in the same partition as much as possible (to avoid data shuffling across machines).  At the end of the execution, actions will be executed at the worker and result will be returned to the driver program.

spark_driver

Spark revolves around the concept of a resilient distributed dataset (RDD), which is a fault-tolerant collection of elements that can be operated on in parallel.

spark_rdd

There are currently two types of RDDs:

  • parallelized collections, which take an existing Scala collection and run functions on it in parallel.
  • Hadoop datasets, which run functions on each record of a file in Hadoop distributed file system or any other storage system supported by Hadoop.

Both types of RDDs can be operated on through the same methods. Each application has a driver process which coordinates its execution.

Running Applications:

Spark applications are similar to MapReduce “jobs”. Each application is a self-contained computation which runs some user-supplied code to compute a result. As with MapReduce jobs, Spark applications can make use of the resources of multiple nodes.

This process can run in the foreground (client mode) or in the background (cluster mode). Client mode is a little simpler, but cluster mode allows you to easily log out after starting a Spark application without terminating the application.

Spark starts executors to perform computations. There may be many executors, distributed across the cluster, depending on the size of the job. After loading some of the executors, Spark attempts to match tasks to executors.

Spark can run in two modes:

  • Standalone mode: Spark uses a Master daemon which coordinates the efforts of the Workers, which run the executors. Standalone mode is the default, but it cannot be used on secure clusters.
  • YARN mode: The YARN ResourceManager performs the functions of the Spark Master. The functions of the Workers are performed by the YARN NodeManager daemons, which run the executors. YARN mode is slightly more complex to set up, but it supports security, and provides better integration with YARN’s cluster-wide resource management policies.

Spark Execution Parameters

–num-executors: The –num-executors command-line flag or spark.executor.instances configuration property control the number of executors requested

–executor-cores: This property controls the number of concurrent tasks an executor can run. –executor-cores 5 means that each executor can run a maximum of five tasks at the same time.

Every Spark executor in an application has the same fixed number of cores and same fixed heap size.

The number of cores can be specified with the –executor-cores flag when invoking spark-submit, spark-shell, and pyspark from the command line.

The heap size can be controlled with the –executor-cores flag or the spark.executor.memory property.

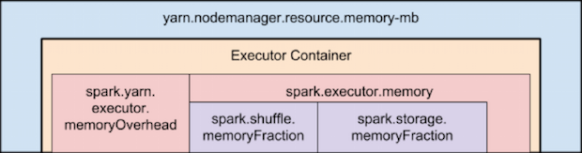
–executor-memory: This property controls the executor heap size, but JVMs can also use some memory off heap, for example for interned Strings and direct byte buffers.

The value of the spark.yarn.executor.memoryOverhead property is added to the executor memory to determine the full memory request to YARN for each executor.

It defaults to max(384, .07 * spark.executor.memory).

Application Master:

Is a non-executor container with the special capability of requesting containers from YARN, takes up resources of its own that must be budgeted in. In yarn-client mode, it defaults to a 1024MB and one vcore. In yarn-cluster mode, the application master runs the driver, so it’s often useful to bolster its resources with the –driver-memory and –driver-cores properties.

Performance – Determining the number of executors:

It’s important to think about how the resources requested by Spark will fit into what YARN has available:
yarn.nodemanager.resource.memory-mb controls the maximum sum of memory used by the containers on each node.
yarn.nodemanager.resource.cpu-vcores controls the maximum sum of cores used by the containers on each node.

spark-tuning-yarn-memory

As an example, in a cluster with six nodes running NodeManagers, each equipped with 16 cores and 64GB of memory:
The NodeManager capacities, yarn.nodemanager.resource.memory-mb and yarn.nodemanager.resource.cpu-vcores, should probably be set to: 63 * 1024 = 64512 (megabytes) and 15 respectively

We must avoid allocating 100% of the resources to YARN containers because the node needs some resources to run the OS and Hadoop daemons.

In this case, we leave a gigabyte and a core for these system processes.

An executors configuration approach could be:
 –num-executors 17 –executor-cores 5 –executor-memory 19G.

This config results in 3 executors per node, except for the one with the AM, which will have 2 executors.
(executor-memory was derived as (63/3 executors per node) = 21.  21 * 0.07 = 1.47.  21 – 1.47 ~ 19)

Conclusions:

  • Depending on the application size (memory), using small executors (several executors per node) will perform better.
  • If the executors are too tiny (with a single core and just enough memory needed to run a single task, for example) throws away the benefits that come from running multiple tasks in a single JVM.
  • The application master, which is a non-executor container with the special capability of requesting containers from YARN, takes up resources of its own that must be budgeted in. In yarn-client mode, it defaults to a 1024MB and one vcore. In yarn-cluster mode, the application master runs the driver, so it’s often useful to bolster its resources with the --driver-memory and --driver-cores properties.

spark-yarn-f22

  • In yarn-cluster mode, the application master runs the driver, so it’s useful to bolster its resources with the –driver-memory and –driver-cores properties.
  • Running executors with too much memory often results in excessive garbage collection delays.

References:

http://horicky.blogspot.ie/2013/12/spark-low-latency-massively-parallel.html
http://blog.cloudera.com/blog/2015/03/how-to-tune-your-apache-spark-jobs-part-2/
https://spark.apache.org/docs/latest/tuning.html

YARN / Map Reduce memory settings


On Hadoop 1, we used to use mapred.child.java.opts to set the Java Heap size for the task tracker child processes.

With YARN, that parameter has been deprecated in favor of:

  • mapreduce.map.java.opts – These parameter is passed to the JVM for mappers.
  • mapreduce.reduce.java.opts – These parameter is passed to the JVM for reducers.

The key thing to understand is that if both mapred.child.java.opts and mapreduce.{map|reduce}.java.opts are specified, the settings in mapred.child.java.opts will be ignored.

The way to set values to these variables is, as example:

mapreduce.map.java.opts = -Xmx1280m
mapreduce.reduce.java.opts= -Xmx2304m

A common error that we will see on our application if it try to run beyond those limits is, as example:

.YarnChild.main(YarnChild.java:162)\nCaused by: java.lang.OutOfMemoryError: Java heap space\

Now, assuming an error like mentioned is at reduce phase, we can increase the value for mapreduce.reduce.java.opts to:

mapreduce.reduce.java.opts = -Xmx3584m

But, we will face another error if we do not increase mapreduce.reduce.memory.mb variable accordingly:

mapreduce.reduce.memory.mb = 4096

A typical error message when Container memory available is lower than maximum Java Heap size is:

containerID=container_1420691746319_0001_01_000151] is running beyond physical memory limits. Current usage: 2.6 GB of 2.5 GB physical memory used; 4.8 GB of 12.5 GB virtual memory used. Killing container.

The general rule of thumb to use is that -Xmx (mapreduce.reduce.java.opts) should be 80% of the size of the equivalent mapreduce.reduce.memory.mb value to account for stack and PermGen space.

As a Summary:

Mapper and Reducer Settings:

  • mapreduce.map.memory.mb – This defines the overall size of the JVM that is used by your mappers.  This value is in megabytes (MB).
  • mapreduce.reduce.memory.mb – This defines the overall size of the JVM that is used by your reducers.  This value is in megabytes (MB).

Yarn-MAP-REDUCE-MB

Containers

As we should know by now, on YARN memory allocation…everything is a container. This includes the following components:

  • Application Master – It controls the execution of the application (such as re-running tasks when they fail).
  • Mappers – Process all of the input files and grab the information out of them necessary to perform the job.
  • Reducers – These containers take information from the mappers and distill it into the final result of the job (which goes into the output files.)

Global Settings

This two properties handles containers memory allocation:

  • yarn.scheduler.minimum.allocation.mb – This is the smallest allowed value for a container.  Any requests for a container that ask for a value smaller than this will be set to this value.  This value is in megabytes (MB).
  • yarn.scheduler.maximum.allocation.mb – This is the largest allowed value for a container.  Any requests for a container that ask for a value larger than this will be set to this value.  This value is in megabytes (MB)


Adding a JAR path to Hadoop classpath


This is simple, but it is a frequent question:

If we need to add some specific path pointing to a thirdparty library we can run a command like the following:

$ export HADOOP_CLASSPATH=$HADOOP_CLASSPATH:/home/hadoop/.versions/Cascading-2.5-SDK/binary/cascading/*:/home/hadoop/.versions/Cascading-2.5-SDK/binary/cascading/lib/cascading-core/*

Here I am adding two directories to the hadoop classpath:

/home/hadoop/.versions/Cascading-2.5-SDK/binary/cascading/*
/home/hadoop/.versions/Cascading-2.5-SDK/binary/cascading/lib/cascading-core/*

We can check the hadoop classpath with the following command:

$ hadoop classpath


Apache Hive: dealing with Out of Memory and Garbage Collector errors.


hive_logo

This is the common error:

java.lang.OutOfMemoryError: GC overhead limit exceeded

This error will occur in several Java environments, but, in particular, with Hive, is pretty common when big structures or several thousands objects are stored in memory.

According to Sun, the error will raise if too much time is being spent in garbage collection:

If more than 98% of the total time is spent in garbage collection and less than 2% of the heap is recovered, an OutOfMemoryError will be thrown.

This feature is designed to prevent applications from running for an extended period of time while making little or no progress because the heap is too small.

If necessary, this feature can be disabled by adding the option -XX:-UseGCOverheadLimit.

Also, we can increase the Heap Size, via “-Xmx1024m” option.

Another interesting option is the Concurrent Collector “UseConcMarkSweepGC“: It performs most of its work concurrently (i.e., while the application is still running) to keep garbage collection pauses short.

It is designed for applications with medium to large-sized data sets for which response time is more important than overall throughput, since the techniques used to minimize pauses can reduce application performance.

In Hive, we can set thes parameters with a  command like this:

SET mapred.child.java.opts="-server -Xmx1g -XX:+UseConcMarkSweepGC -XX:-UseGCOverheadLimit";


An alternative to avoid storing all the structure in memory:

Write intermediate results to a temporary table in the database instead of hashmaps, a database table table is not memory bound, so use an indexed table is a solution in many cases.

When the intermediate table is complete, execute a sql statement(s) from it instead of from memory.

Simple Java Telnet Port Scanner


It can be improved in many ways, but..

import java.io.*;  
import java.net.*;  
import java.util.*;  
import java.util.TimerTask;  
//import org.apache.commons.*;
//import org.apache.commons.net.telnet.TelnetClient;  
class Connectivity extends TimerTask  
{  
    public static void main(String args[])  
    {  
        try  
        {  
            System.out.println("Please enter ip address");  
            Scanner sc=new Scanner(System.in);  
            String ip=sc.nextLine().trim();  
            System.out.println("Please enter port number");  
            TimerTask con  = new Connectivity();  
            Scanner sc1=new Scanner(System.in);  
            int port=sc1.nextInt();  
            Timer timer = new Timer();  
            timer.scheduleAtFixedRate(con,1,1000);  
            Socket s1=new Socket(ip,port);  
            InputStream is=s1.getInputStream();  
            DataInputStream dis=new DataInputStream(is);  
            if(dis!=null)  
            {  
                System.out.println("Connected with ip "+ip+" and port "+port);  
            }  
            else  
            {  
                System.out.println("Connection invalid");  
            }  
              
            dis.close();  
            s1.close();  
              
        }  
        catch(Exception e)  
        {  
            System.out.println("Not Connected,Please enter proper input");  
              
        }  
          
    }  
 
    @Override  
    public void run() {  
        // TODO Auto-generated method stub  
          
    }  
}

Testing Java Cryptography Extension (JCE) is installed


If JCE is already installed, you should see on that the jar files ‘local_policy.jar’ and ‘US_export_policy.jar’ are on $JAVA_HOME/jre/lib/security/

But, we can test it:

import javax.crypto.Cipher;
import java.security.*;
import javax.crypto.*;

class TestJCE {
 public static void main(String[] args) {
 boolean JCESupported = false;
 try {
    KeyGenerator kgen = KeyGenerator.getInstance("AES", "SunJCE");
    kgen.init(256);
    JCESupported = true;
 } catch (NoSuchAlgorithmException e) {
    JCESupported = false;
 } catch (NoSuchProviderException e) {
    JCESupported = false;
 }
    System.out.println("JCE Supported=" + JCESupported);
 }
} 

To compile (assuming file name is TestJCE.java):

$ javac TestJCE.java

Previous command will create TestJCE.class output file.

To Interpreting and Running the program:

$ java TestJCE