Never go out without it:
hive --hiveconf hive.root.logger=DEBUG,console
Never go out without it:
hive --hiveconf hive.root.logger=DEBUG,consoleThis is a very specific error related to the Spark Executor and the YARN container coexistence.
You will typically see errors like this one on the application container logs:
15/03/12 18:53:46 WARN YarnAllocator: Container killed by YARN for exceeding memory limits. 9.3 GB of 9.3 GB physical memory used. Consider boosting spark.yarn.executor.memoryOverhead.
15/03/12 18:53:46 ERROR YarnClusterScheduler: Lost executor 21 on ip-xxx-xx-xx-xx: Container killed by YARN for exceeding memory limits. 9.3 GB of 9.3 GB physical memory used. Consider boosting spark.yarn.executor.memoryOverhead.
To overcome this, you need to keep in mind how Yarn container and the executor are set in memory:
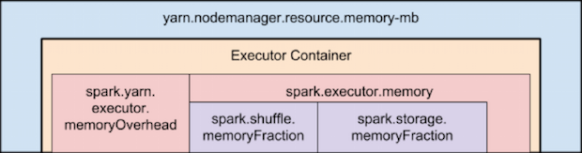
Memory used by Spark Executor is exceeding the predefined limits (often caused by a few spikes) and that is causing YARN to kill the container with the previously mentioned message error.
By default ‘spark.yarn.executor.memoryOverhead’ parameter is set to 384 MB. This value could be low depending on your application and the data load.
Suggested value for this parameter is ‘executorMemory * 0.10’.
We can increase the value for ‘spark.yarn.executor.memoryOverhead’ to 1GB on spark-submit bu adding this to the command line:
–conf spark.yarn.executor.memoryOverhead=1024
For reference, this fix was added on Jira 1930:
+ <td><code>spark.yarn.executor.memoryOverhead</code></td>
Apache Spark, is an open source cluster computing framework originally developed at University of California, Berkeley but was later donated to the Apache Software Foundation where it remains today. In contrast to Hadoop’s two-stage disk-based MapReduce paradigm, Spark’s multi-stage in-memory primitives provides performance up to 100 faster for certain applications.
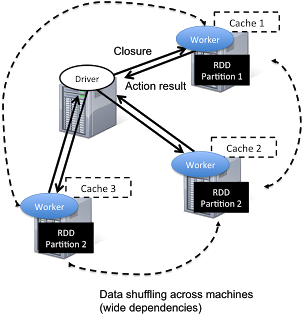
Spark has a driver program where the application logic execution is started, with multiple workers which processing data in parallel.
The data is typically collocated with the worker and partitioned across the same set of machines within the cluster. During the execution, the driver program will pass the code/closure into the worker machine where processing of corresponding partition of data will be conducted.
The data will undergoing different steps of transformation while staying in the same partition as much as possible (to avoid data shuffling across machines). At the end of the execution, actions will be executed at the worker and result will be returned to the driver program.
Spark revolves around the concept of a resilient distributed dataset (RDD), which is a fault-tolerant collection of elements that can be operated on in parallel.

There are currently two types of RDDs:
Both types of RDDs can be operated on through the same methods. Each application has a driver process which coordinates its execution.
Spark applications are similar to MapReduce “jobs”. Each application is a self-contained computation which runs some user-supplied code to compute a result. As with MapReduce jobs, Spark applications can make use of the resources of multiple nodes.
This process can run in the foreground (client mode) or in the background (cluster mode). Client mode is a little simpler, but cluster mode allows you to easily log out after starting a Spark application without terminating the application.
Spark starts executors to perform computations. There may be many executors, distributed across the cluster, depending on the size of the job. After loading some of the executors, Spark attempts to match tasks to executors.
Spark can run in two modes:
–num-executors: The –num-executors command-line flag or spark.executor.instances configuration property control the number of executors requested
–executor-cores: This property controls the number of concurrent tasks an executor can run. –executor-cores 5 means that each executor can run a maximum of five tasks at the same time.
Every Spark executor in an application has the same fixed number of cores and same fixed heap size.
The number of cores can be specified with the –executor-cores flag when invoking spark-submit, spark-shell, and pyspark from the command line.
The heap size can be controlled with the –executor-cores flag or the spark.executor.memory property.
–executor-memory: This property controls the executor heap size, but JVMs can also use some memory off heap, for example for interned Strings and direct byte buffers.
The value of the spark.yarn.executor.memoryOverhead property is added to the executor memory to determine the full memory request to YARN for each executor.
It defaults to max(384, .07 * spark.executor.memory).
Application Master:
Is a non-executor container with the special capability of requesting containers from YARN, takes up resources of its own that must be budgeted in. In yarn-client mode, it defaults to a 1024MB and one vcore. In yarn-cluster mode, the application master runs the driver, so it’s often useful to bolster its resources with the –driver-memory and –driver-cores properties.
It’s important to think about how the resources requested by Spark will fit into what YARN has available:
– yarn.nodemanager.resource.memory-mb controls the maximum sum of memory used by the containers on each node.
– yarn.nodemanager.resource.cpu-vcores controls the maximum sum of cores used by the containers on each node.

As an example, in a cluster with six nodes running NodeManagers, each equipped with 16 cores and 64GB of memory:
The NodeManager capacities, yarn.nodemanager.resource.memory-mb and yarn.nodemanager.resource.cpu-vcores, should probably be set to: 63 * 1024 = 64512 (megabytes) and 15 respectively
We must avoid allocating 100% of the resources to YARN containers because the node needs some resources to run the OS and Hadoop daemons.
In this case, we leave a gigabyte and a core for these system processes.
An executors configuration approach could be:
–num-executors 17 –executor-cores 5 –executor-memory 19G.
This config results in 3 executors per node, except for the one with the AM, which will have 2 executors.
(executor-memory was derived as (63/3 executors per node) = 21. 21 * 0.07 = 1.47. 21 – 1.47 ~ 19)
--driver-memory and --driver-cores properties.
http://horicky.blogspot.ie/2013/12/spark-low-latency-massively-parallel.html
http://blog.cloudera.com/blog/2015/03/how-to-tune-your-apache-spark-jobs-part-2/
https://spark.apache.org/docs/latest/tuning.html
Tez enables developers to build end-user applications with much better performance and flexibility. It generalizes the MapReduce paradigm to a more powerful framework based on expressing computations as a dataflow graph.
The is designed to get around limitations imposed by MapReduce. Other than being limited to writing mappers and reducers, there are other inefficiencies in force-fitting all kinds of computations into this paradigm – for e.g. HDFS is used to store temporary data between multiple MR jobs, which is an overhead. In Hive, this is common when queries require multiple shuffles on keys without correlation, such as with join – grp by – window function – order by.

The Tez API has the following components:
DAG: this defines the overall job. The user creates a DAG object for each data processing job.
Vertex: this defines the user logic and the resources & environment needed to execute the user logic. The user creates a Vertex object for each step in the job and adds it to the DAG.
Edge: this defines the connection between producer and consumer vertices. The user creates an Edge object and connects the producer and consumer vertices using it.
It allows you, for e.g., instead of using multiple MapReduce jobs, you can use the MRR pattern, such that a single map has multiple reduce stages; this can allow streaming of data from one processor to another to another, without writing anything to HDFS (it will be written to disk only for check-pointing), leading to much better performance.

Re-use containers:
Tez follows the traditional Hadoop model of dividing a job into individual tasks, all of which are run as processes via YARN, on the users’ behalf. This model comes with inherent costs for process startup and initialization, handling stragglers and allocating each container via the YARN resource manager.
Sources:
http://hortonworks.com/hadoop/tez/#section_2
http://www.infoq.com/articles/apache-tez-saha-murthy
This is sometimes useful when playing with bigdata.
Instead of a dd command and wait the file being created block by clock, we can run:
$ fallocate -l 200G /mnt/reallyBigFile.csvIt essentially “allocates” all of the space you’re seeking, but it doesn’t bother to write anything. So, when you use fallocate to create a 200 GB virtual drive space, you really do get a 200 GB file.
This is a topic that always rise a discussion…
In Hadoop 1, the number of tasks launched per node was specified via the settings mapred.map.tasks.maximum and mapred.reduce.tasks.maximum.
But this is ignored when set on Hadoop 2.
In Hadoop 2 with YARN, we can determine how many concurrent tasks are launched per node by dividing the resources allocated to YARN by the resources allocated to each MapReduce task, and taking the minimum of the two types of resources (memory and CPU).
This approach is an improvement over that of Hadoop 1, because the administrator no longer has to bundle CPU and memory into a Hadoop-specific concept of a “slot”.
The number of tasks that will be spawned per node:
min(
    yarn.nodemanager.resource.memory-mb / mapreduce.[map|reduce].memory.mb
    ,
    yarn.nodemanager.resource.cpu-vcores / mapreduce.[map|reduce].cpu.vcores
    )
Obtained value will be set on the variable ‘mapreduce.job.maps‘ on the ‘mapred-site.xml‘ file.
Of course, YARN is more dynamic than that, and each job can have unique resource requirements — so in a multitenant cluster with different types of jobs running, the calculation isn’t as straightforward.
More information:
http://blog.cloudera.com/blog/2014/04/apache-hadoop-yarn-avoiding-6-time-consuming-gotchas/
1) Search for files on corrupt files:
A command like ‘hadoop fsck /’ will show the status of the filesystem and any corrupt files. This command will ignore lines with nothing but dots and lines talking about replication:
hadoop fsck / | egrep -v '^\.+$' | grep -v eplica
2) Determine the corrupt blocks:
hadoop fsck /path/to/corrupt/file -locations -blocks -files
(Use that output to determine where blocks might live. If the file is larger than your block size it might have multiple blocks.)
3) Try to copy the files to S3 with s3distcp or s3cmd. If that fails, you will have the option to run:
hadoop fsck -move
which will move what is left of the corrupt blocks into hdfs /lost+found
4) Delete the file:
hadoop fs -rm /path/to/file/with/permanently/missing/blocks
Check file system state again with step 1.
A more drastic command is:
hadoop fsck / -delete
that will search and delete all corrupted files.
Hadoop should not use corrupt blocks again unless the replication factor is low and it does not have enough replicas
References:
http://hadoop.apache.org/docs/r0.19.0/commands_manual.html#fsck
Este es el formato del comando distcp para copiar de hdfs a hdfs considerando cluster origen y destino en Amazon AWS:
hadoop distcp "hdfs://ec2-54-86-202-252.compute-1.amazonaws.comec2-2:9000/tmp/test.txt" "hdfs://ec2-54-86-229-249.compute-1.amazonaws.comec2-2:9000/tmp/test1.txt"
Mas informacion sobre distcp:
http://www.cloudera.com/content/cloudera-content/cloudera-docs/CDH4/latest/CDH4-Installation-Guide/cdh4ig_topic_7_2.html
http://hadoop.apache.org/docs/r1.2.1/distcp2.html
El diseño del sistema de archivos HDFS se basa en el Google File System (GFS).
– Es capaz de almacenar una gran cantidad de datos (terabytes o petabytes).
– Esta diseñado para almacenar los datos a traves de un gran numero de maquinas.
– Implementa replicacion de datos para enfrentar mal funcionamiento o perdida de equipos en el cluster.
– Para mejorar la relacion Hadoop – MapReduce, HDFS permite que los datos sean leidos y procesados localmente.

Los archivos de entrada se dividen en bloques de un tamaño fijo (64Mb por default), que se almacenan de manera distribuida en un cluster Hadoop. Un archivo puede estar formado por varios bloques, que se almacenan en diferentes DataNodes (máquinas individuales en el cluster) escogidos al azar. Como resultado, el acceso a un archivo por lo general requiere el acceso a múltiples DataNodes, lo que significa que el HDFS soporta tamaños de archivo mucho más grandes que una capacidad de disco de una sola máquina.
El NameNode, almacena toda la metadata del sistema de archivos en el clúster. Esto significa que HDFS implementa una arquitectura maestro / esclavo. Un único NameNode (que es un servidor primario) gestiona el espacio de nombres del sistema de archivos y se regula el acceso a los archivos de los clientes. La existencia de un único maestro en un clúster simplifica en gran medida la arquitectura del sistema, pero tiene como debilidad que es un unico punto de falla (Single Point of Failure). El NameNode sirve como un solo árbitro y repositorio para todos los metadatos HDFS.
Debido a la relativamente baja cantidad de metadata por archivo (sólo controla los nombres de archivo, los permisos y la ubicación de cada bloque), el NameNode almacena todos los metadatos en la memoria principal, lo que permite un rápido acceso aleatorio. Como resultado, un NameNode con 4 GB de RAM es capaz de soportar un gran número de archivos y directorios.
Varios DataNodes son servidores de un unico archivo, lo que significa que un archivo puede estar disponible en caso de que se pierda una de esas máquinas. HDFS replica cada bloque a través de una serie de máquinas (tres, de manera predeterminada).
Cada DataNode envía periódicamente un heartbeat al NameNode. El NameNode marca los DataNode que no han enviado su hearbeat durante 10 minutos (default) como muertos y deja de enviar I/O requests a dichos nodos. Alli comienza el proceso de replicacion de los datos que contenia dicho nodo para mantener el replication factor (3 por default).
Si el replication factor es de 3, significa que el dato tiene que estar almacenado en 3 nodos en todo momento.
Muchas veces necesitamos debugear alguna consulta Hive que esta dando error. Una manera facil es habilitar el logger por consola:
hive.root.logger specifies the logging level as well as the log destination. Specifying console as the target sends the logs to the standard error (instead of the log file).
$HIVE_HOME/bin/hive -hiveconf hive.root.logger=INFO,console
Mas informacion:
https://cwiki.apache.org/confluence/display/Hive/LanguageManual+Cli
