The power of @endlesspaper. pic.twitter.com/XwJeGbXN2d
— Brian Roemmele (@BrianRoemmele) October 7, 2022
The power of @endlesspaper
Reply

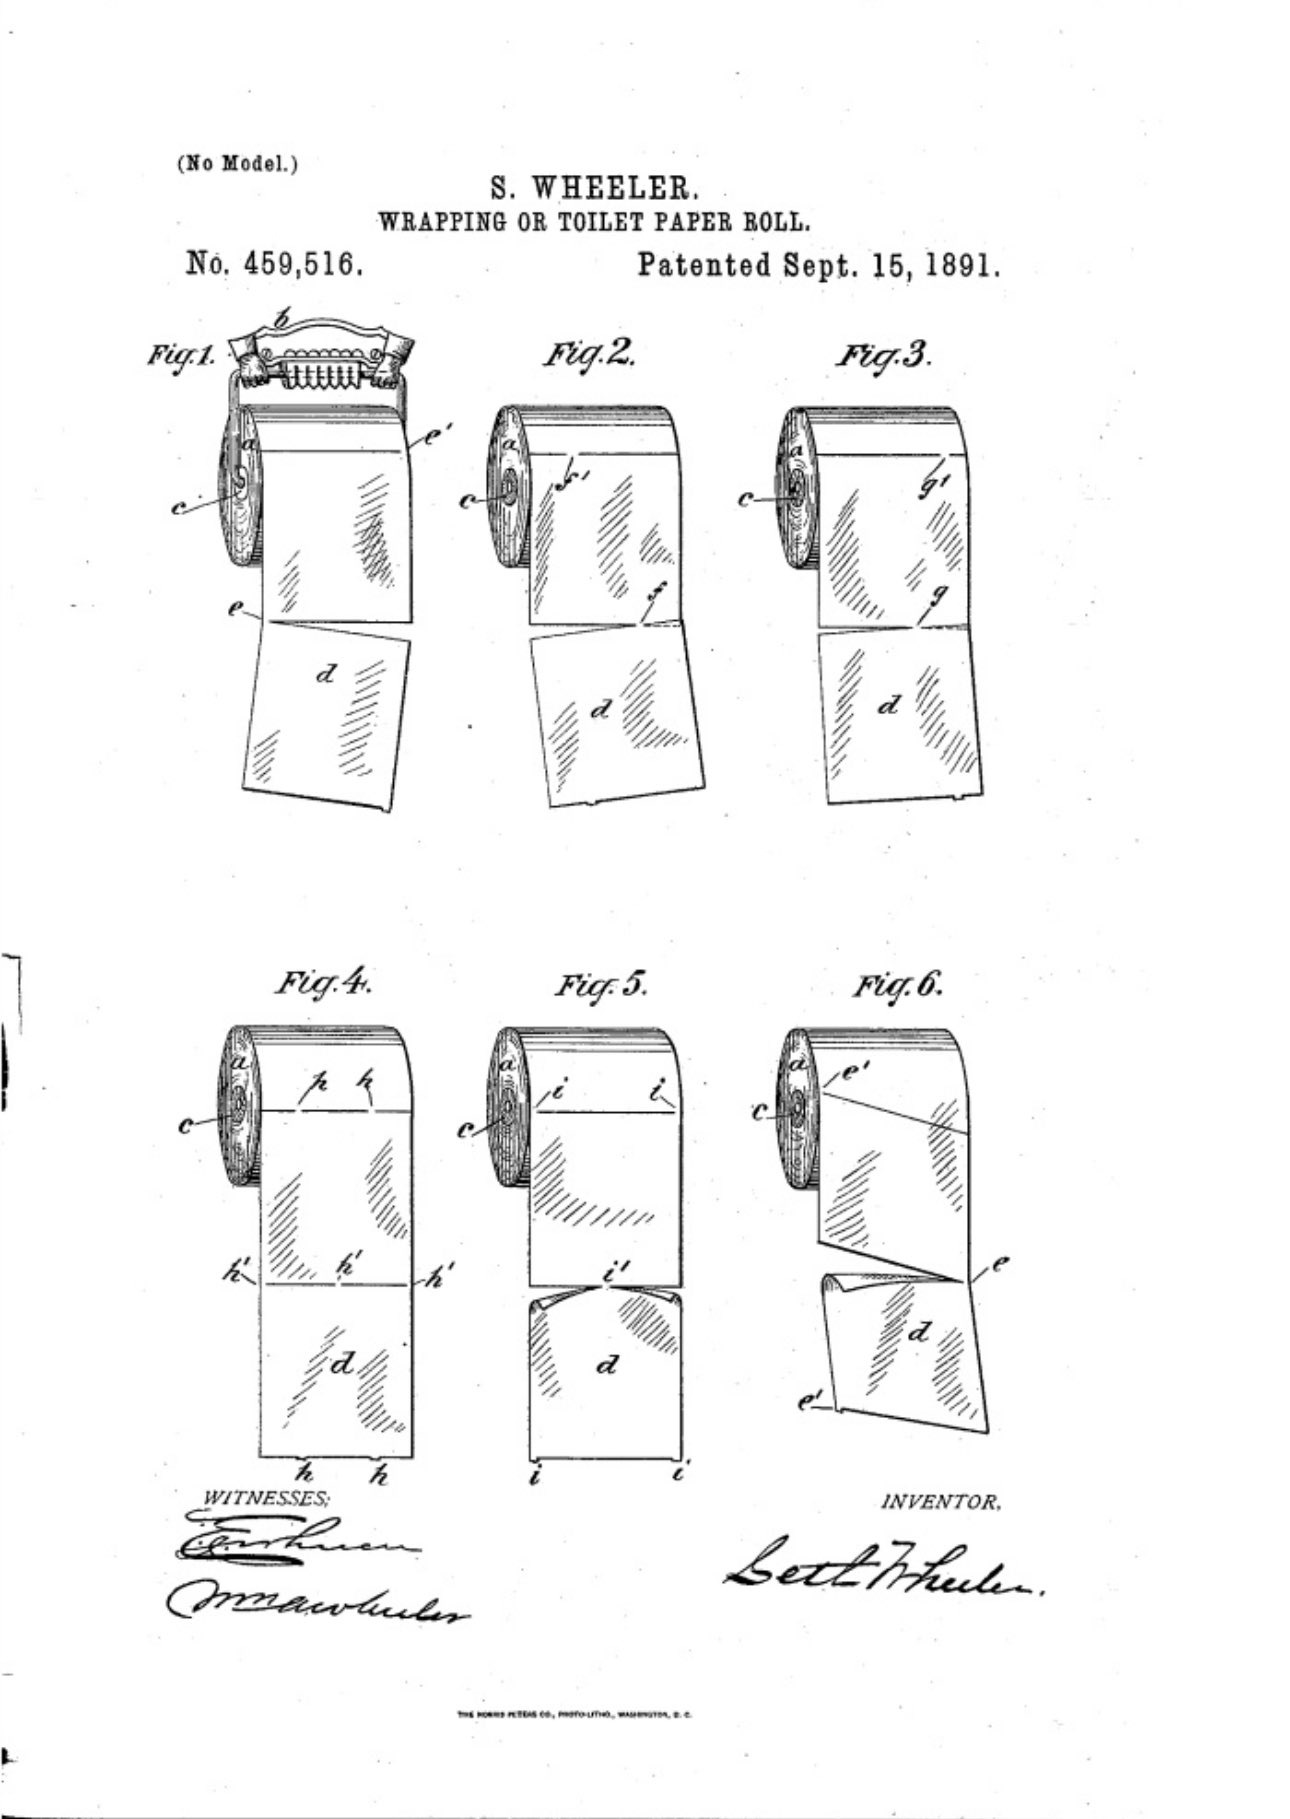
The original toilet paper patent from 1891. Note the orientation for the roll: you unroll toilet paper from top to bottom.

The Boeing 377 Stratocruiser was a large long-range airliner developed from the C-97 Stratofreighter military transport, itself a derivative of the B-29 Superfortress. The Stratocruiser’s first flight was on July 8, 1947. Its design was advanced for its day; its innovative features included two passenger decks and a pressurized cabin. It could carry up to 100 passengers on the main deck plus 14 in the lower deck lounge; typical seating was for 63 or 84 passengers or 28 berthed and five seated passengers.
Quick reference of this noble and old school command.
Very useful for troubleshooting and server performance.
By default, sar command will report the CPU activity of the server. The option -u can be used to get the CPU utilization report.
To get the CPU activity report in every 2 seconds for 3 times:
$ sar -u 2 3

Linux 3.10.0-1127.10.1.el7.x86_64 (localhost.localdomain) 	09/06/2020 	_x86_64_	(2 CPU)

22:26:54        CPU     %user     %nice   %system   %iowait    %steal     %idle
22:26:56        all      4,03      0,00      0,50      0,00      0,00     95,47
22:26:58        all      8,08      0,00      0,51      0,00      0,00     91,41
22:27:00        all     12,50      0,00      1,00      0,00      0,00     86,50
Average:        all      8,21      0,00      0,67      0,00      0,00     91,11
To find the CPU activity on all processors separately, you need to use the -P option.
$ sar -P ALL 1 1

Linux 3.10.0-1127.10.1.el7.x86_64 (localhost.localdomain) 	10/06/2020 	_x86_64_	(2 CPU)

05:38:18        CPU     %user     %nice   %system   %iowait    %steal     %idle
05:38:19        all      3,03      0,00      0,00      0,00      0,00     96,97
05:38:19          0      3,96      0,00      0,99      0,00      0,00     95,05
05:38:19          1      3,00      0,00      0,00      0,00      0,00     97,00

Average:        CPU     %user     %nice   %system   %iowait    %steal     %idle
Average:        all      3,03      0,00      0,00      0,00      0,00     96,97
Average:          0      3,96      0,00      0,99      0,00      0,00     95,05
Average:          1      3,00      0,00      0,00      0,00      0,00     97,00
To find the memory usage (used and free memory of the server) over time using the -r switch.
$ sar -r 1 3

Linux 3.10.0-1127.10.1.el7.x86_64 (localhost.localdomain) 	10/06/2020 	_x86_64_	(2 CPU)

05:41:04    kbmemfree kbmemused  %memused kbbuffers  kbcached  kbcommit   %commit  kbactive   kbinact   kbdirty
05:41:05       855300   3025220     77,96         0   1495276   2426864     30,55   1265008   1158172       100
05:41:06       854800   3025720     77,97         0   1495276   2426864     30,55   1265132   1158172       100
05:41:07       855032   3025488     77,97         0   1495276   2426864     30,55   1265012   1158172       100
Average:       855044   3025476     77,97         0   1495276   2426864     30,55   1265051   1158172       100
Check the swap usage of the machine using the -W option:
$ sar -W 1 3
Linux 2.6.18-274.18.1.el5 (myserver) 09/06/2012
03:31:12 PM pswpin/s pswpout/s
03:31:13 PM 16.16 0.00
03:31:14 PM 16.00 0.00
03:31:15 PM 15.84 0.00
Average: 16.00 0.00
You can find the load averages overtime using the -q option:
$ sar -q 1 3

Linux 3.10.0-1127.10.1.el7.x86_64 (localhost.localdomain) 	10/06/2020 	_x86_64_	(2 CPU)

06:16:13      runq-sz  plist-sz   ldavg-1   ldavg-5  ldavg-15   blocked
06:16:14            0       329      0,00      0,04      0,09         0
06:16:15            0       329      0,00      0,04      0,09         0
06:16:16            0       329      0,00      0,04      0,09         0
Average:            0       329      0,00      0,04      0,09         0
$ sar -F 2 3

Linux 3.10.0-1127.10.1.el7.x86_64 (localhost.localdomain) 	10/06/2020 	_x86_64_	(2 CPU)

06:30:18     MBfsfree  MBfsused   %fsused  %ufsused     Ifree     Iused    %Iused FILESYSTEM
06:30:20        30410      5532     15,39     15,39  18245113    166407      0,90 /dev/mapper/centos-root
06:30:20          796       218     21,52     21,52    523947       341      0,07 /dev/sda1

06:30:20     MBfsfree  MBfsused   %fsused  %ufsused     Ifree     Iused    %Iused FILESYSTEM
06:30:22        30410      5532     15,39     15,39  18245113    166407      0,90 /dev/mapper/centos-root
06:30:22          796       218     21,52     21,52    523947       341      0,07 /dev/sda1

06:30:22     MBfsfree  MBfsused   %fsused  %ufsused     Ifree     Iused    %Iused FILESYSTEM
06:30:24        30410      5532     15,39     15,39  18245113    166407      0,90 /dev/mapper/centos-root
06:30:24          796       218     21,52     21,52    523947       341      0,07 /dev/sda1

Summary:     MBfsfree  MBfsused   %fsused  %ufsused     Ifree     Iused    %Iused FILESYSTEM
Summary         30410      5532     15,39     15,39  18245113    166407      0,90 /dev/mapper/centos-root
Summary           796       218     21,52     21,52    523947       341      0,07 /dev/sda1
$ sar -v 2 3

Linux 3.10.0-1127.10.1.el7.x86_64 (localhost.localdomain) 	10/06/2020 	_x86_64_	(2 CPU)

06:57:23    dentunusd   file-nr  inode-nr    pty-nr
06:57:25       160833      2400    132081         3
06:57:27       160833      2400    132081         3
06:57:29       160833      2400    132081         3
Average:       160833      2400    132081         3
$ sar -n DEV

Linux 3.10.0-1127.10.1.el7.x86_64 (localhost.localdomain) 	10/06/2020 	_x86_64_	(2 CPU)

19:20:23        IFACE   rxpck/s   txpck/s    rxkB/s    txkB/s   rxcmp/s   txcmp/s  rxmcst/s
19:20:24       ens192     11,00      4,00      1,80      2,75      0,00      0,00      0,00
19:20:24           lo     79,00     79,00     43,62     43,62      0,00      0,00      0,00

Average:        IFACE   rxpck/s   txpck/s    rxkB/s    txkB/s   rxcmp/s   txcmp/s  rxmcst/s
Average:       ens192     11,00      4,00      1,80      2,75      0,00      0,00      0,00
Average:           lo     79,00     79,00     43,62     43,62      0,00      0,00
$ sar -I XALL 2 10
02:07:10 AM INTR intr/s
02:07:12 AM 0 992.57
02:07:12 AM 1 0.00
02:07:12 AM 2 0.00
02:07:12 AM 3 0.00
02:07:12 AM 4 0.00
02:07:12 AM 5 0.00
02:07:12 AM 6 0.00
02:07:12 AM 7 0.00
02:07:12 AM 8 0.00
02:07:12 AM 9 350.50
‘/proc/interrupts’ file will also provide helpful information. Interrupt halts CPU processing so that I/O or other operations can occur. Processing resumes after the specific operation takes place. It is very important that each device installed in machine is provided with an interrupt setting that does not conflict with the settings used by the hardware and other devices.
$ sudo cat /proc/interrupts

           CPU0       CPU1
  0:         48          0   IO-APIC-edge      timer
  1:         54          0   IO-APIC-edge      i8042
  8:          1          0   IO-APIC-edge      rtc0
  9:          0          0   IO-APIC-fasteoi   acpi
 12:         35        116   IO-APIC-edge      i8042
 14:          0          0   IO-APIC-edge      ata_piix
 15:          0          0   IO-APIC-edge      ata_piix
 16:        118       2513   IO-APIC-fasteoi   vmwgfx
 24:          0          0   PCI-MSI-edge      PCIe PME, pciehp
 25:          0          0   PCI-MSI-edge      PCIe PME, pciehp
 26:          0          0   PCI-MSI-edge      PCIe PME, pciehp
 27:          0          0   PCI-MSI-edge      PCIe PME, pciehp
NMI:          0          0   Non-maskable interrupts
LOC:   35392807   14792833   Local timer interrupts
SPU:          0          0   Spurious interrupts
PMI:          0          0   Performance monitoring interrupts
IWI:    2677624     215297   IRQ work interrupts
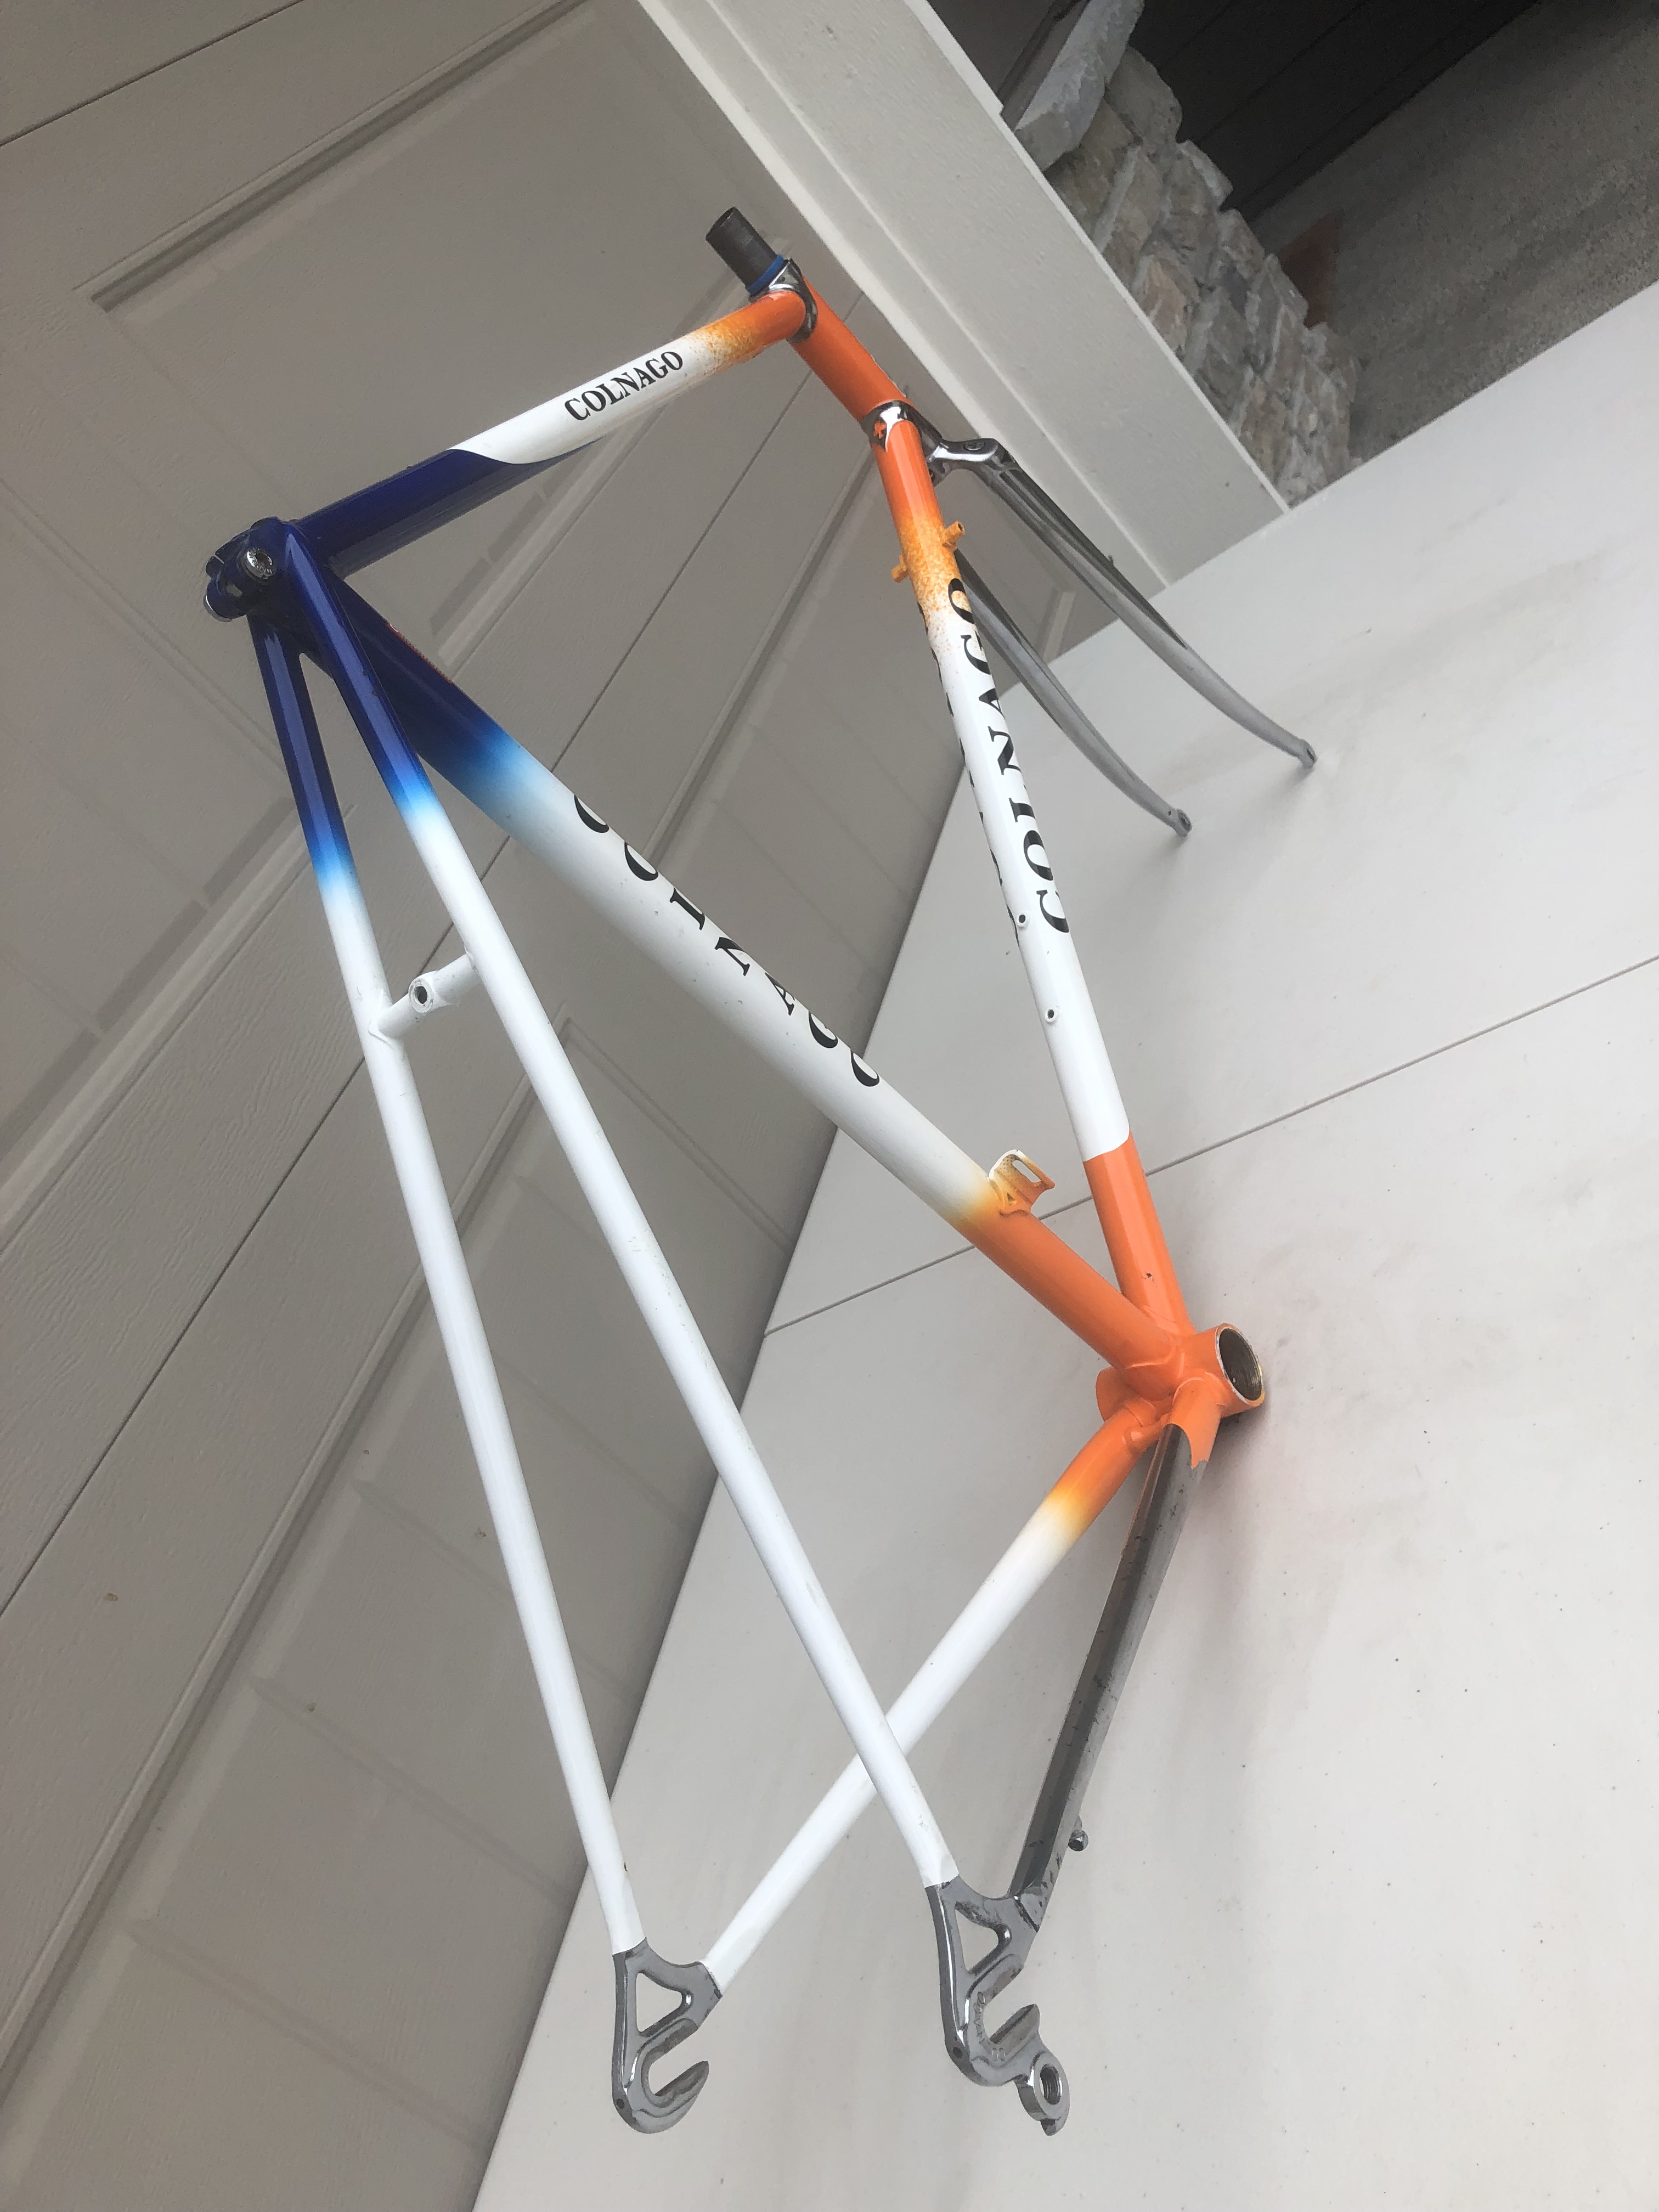
SOLD 08/2022
This Colnago C96 just arrived from Netherlands. Rabobank team paint scheme.


If you start seeing these errors it means your server or instance started running out of kernel memory.
[10223.291166] java: page allocation failure: order:0, mode:0x1080020(GFP_ATOMIC), nodemask=(null)
[10223.301794] java cpuset=/ mems_allowed=0-1
[10223.307211] CPU: 29 PID: 19395 Comm: java Not tainted 4.14.154-99.181.amzn1.x86_64 #1
[10223.315658] Hardware name: Xen HVM domU, BIOS 4.2.amazon 08/24/2006
[10223.322004] Call Trace:
[10223.325230]  <IRQ>
[10223.328193]  dump_stack+0x66/0x82
[10223.332213]  warn_alloc+0xe0/0x180
In particular, these Order 0 (zero) errors, mean there isn’t even a single 4K page available to allocate.
This might sound weird on a system were we have a lot of RAM memory available. And actually, this may be a common situation on systems where the kernel is not tuned up properly.
In particular, we need to look at the following kernel parameter:
min_free_kbytes:

This is used to force the Linux VM to keep a minimum number
of kilobytes free.  The VM uses this number to compute a
watermark[WMARK_MIN] value for each lowmem zOn one in the system.
Each lowmem zone gets a number of reserved free pages based
proportionally on its size.

Some minimal amount of memory is needed to satisfy PF_MEMALLOC
allocations; if you set this to lower than 1024KB, your system will
become subtly broken, and prone to deadlock under high loads.

Setting this too high will OOM your machine instantly.

On systems with very large amount of RAM memory, this parameter is usually set too low. Change default value (have a look to the previous paragraph to avoid too low or too high values) and restart with sysctl. 1GB is the value I use on most of the large memory servers (64GB+).
sudo sed -i '${s/$/'"\nvm.min_free_kbytes = 1048576"'/}' /etc/sysctl.conf
sysctl vm.min_free_kbytes

echo "reloading the settings:"
sudo /sbin/sysctl -p
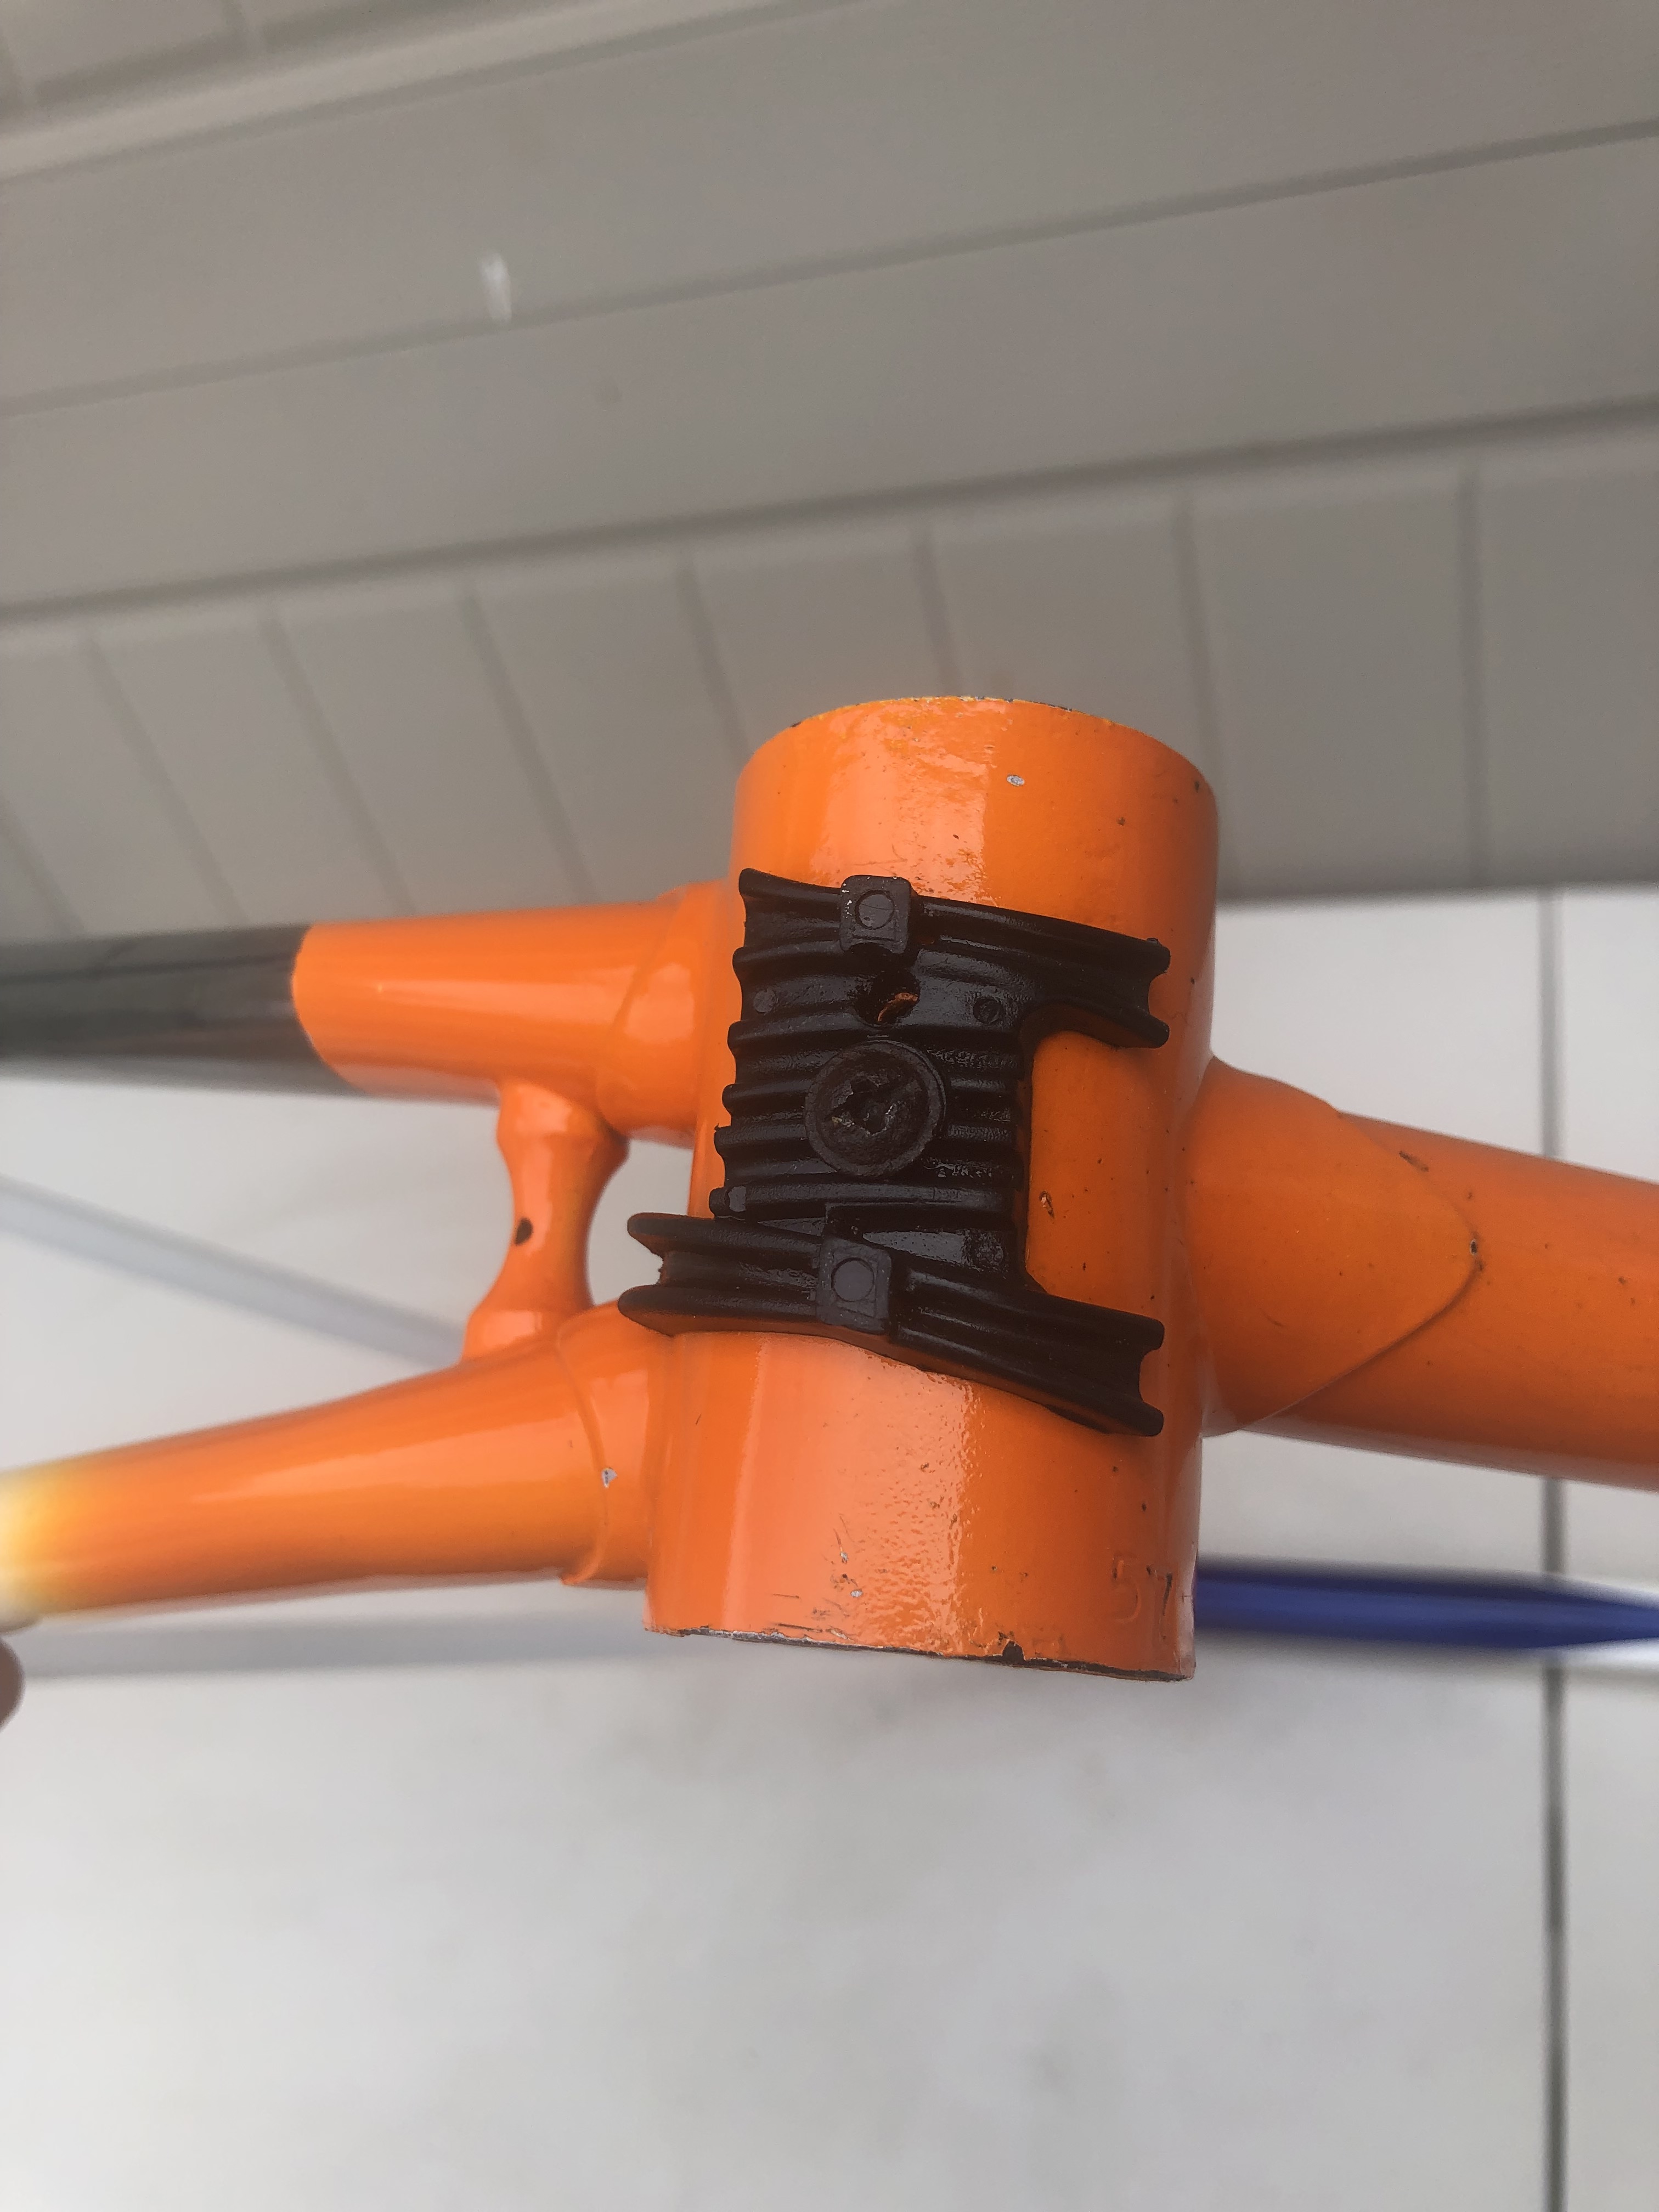
Starting the restoring process on this Eddy Merckx Corsa-01.


The symbols to the left of the BB cover (“technical”) are divided into 3 categories:
The symbols to the right of the BB cover (“statistical”) form a serial number, it consists of a letter and a set of digits. A letter means another series of frames, a number is another frame in the series (001-9999). The exception is the production from 1980 (there is no letter, and in the prototypes even digits, and there are just over 1000 of them).
E – 1981-1984
Z – 1984-1986
A – 1986-1988
B – 1988-1990
C – 1990-1991
D – 1992-1993
F – 1994-1995
G – 1996-1998
H – 1998-2000
J – 2001-2002
K – 2002-2004
L – 2004-2006
P – 2006-2008
In addition to such markings, there are unusual ones:
CS – Capri Sonne
ED – Europ Decor
W – Winning ?
KE – Kelme
HL186P – Hans Lubberding 1986 Pista (Panasonic) and similar – his teammates

https://www.retrobike.co.uk/threads/eddy-merckx-decoding-for-everyone.410031/
Are you looking for new challenges?
At Project Kuiper we are working to provide broadband internet service to tens of millions of people around the world who are currently underserved. Come join us!
Do you want to know more about this project? have a look to this video:
Here are some of our current openings. Feel free to reach out directly to me if you want to know more about these or other positions.
Senior Systems Development Engineer
Senior Ecad Tools Application Engineer
I just wanted to write a couple lines/guidance on this regard as this is a recurring question when configuring storage, not only in the cloud, but can also happen on bare metal servers.
Throughput is the measure of the amount of data transferred from/to a storage device per time unit (typically seconds).
The throughput consumed on a volume is calculated using this formula:
IOPS (IO Ops per second) x BS (block size)= Throughput
As example, if we are writing at 1200 Ops/Sec, and the chunk write size is around 125Kb, we will have a total throughput of about 150Mb/sec.
This is important because we have to be aware of the Maximum Total Throughput Capacity for a specific volume vs the Maximum Total Instance Throughput.
Because, if your instance type (or server) is able to produce a throughput of 1250MiB/s (i.e M4.16xl)) and your EBS Maximum Throughput is 500MiB/s (i.e. ST1), not only you will hit a bottleneck trying to write to the specific volumes, but also throttling might occur (i.e. EBS on cloud services).
Here is documentation about Maximum Instance Throughput for every instance type on EC2: https://docs.aws.amazon.com/AWSEC2/latest/UserGuide/ebs-optimized.html
And here about the EBS Maximum Volume throughput: https://docs.aws.amazon.com/AWSEC2/latest/UserGuide/ebs-volume-types.html
If we have an instance/server that has more throughput capabilities than the volume, just add or split the storage capacity into more volumes. So the load/throughput will be distributed across the volumes.
As an example, here are some metrics with different volume configurations:
1 x 3000GB – 9000IOPS volume:
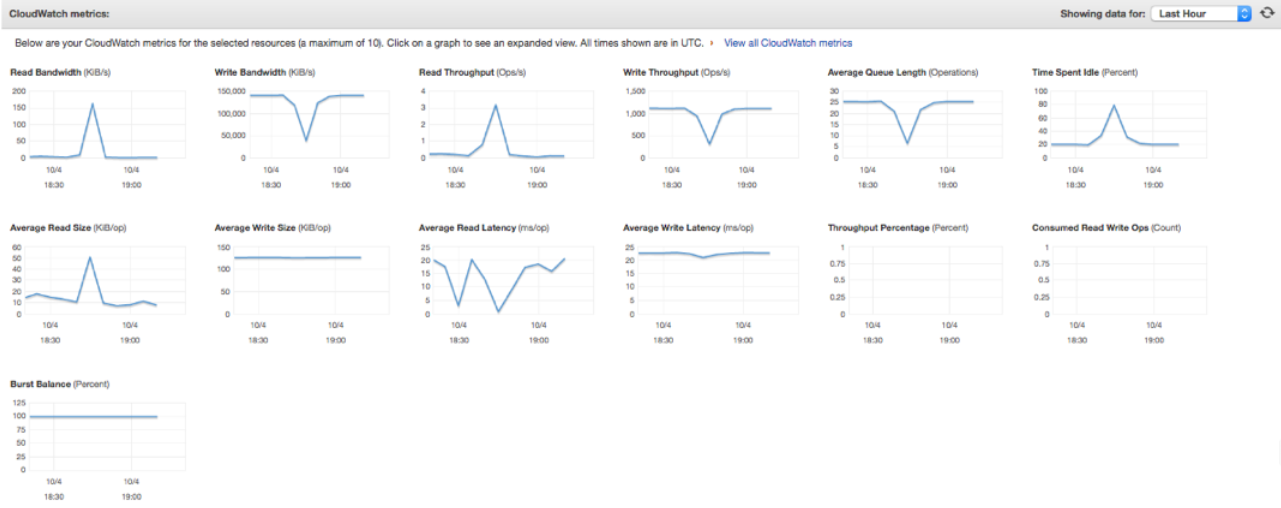
3 x 1000GB – 3000IOPS volume:
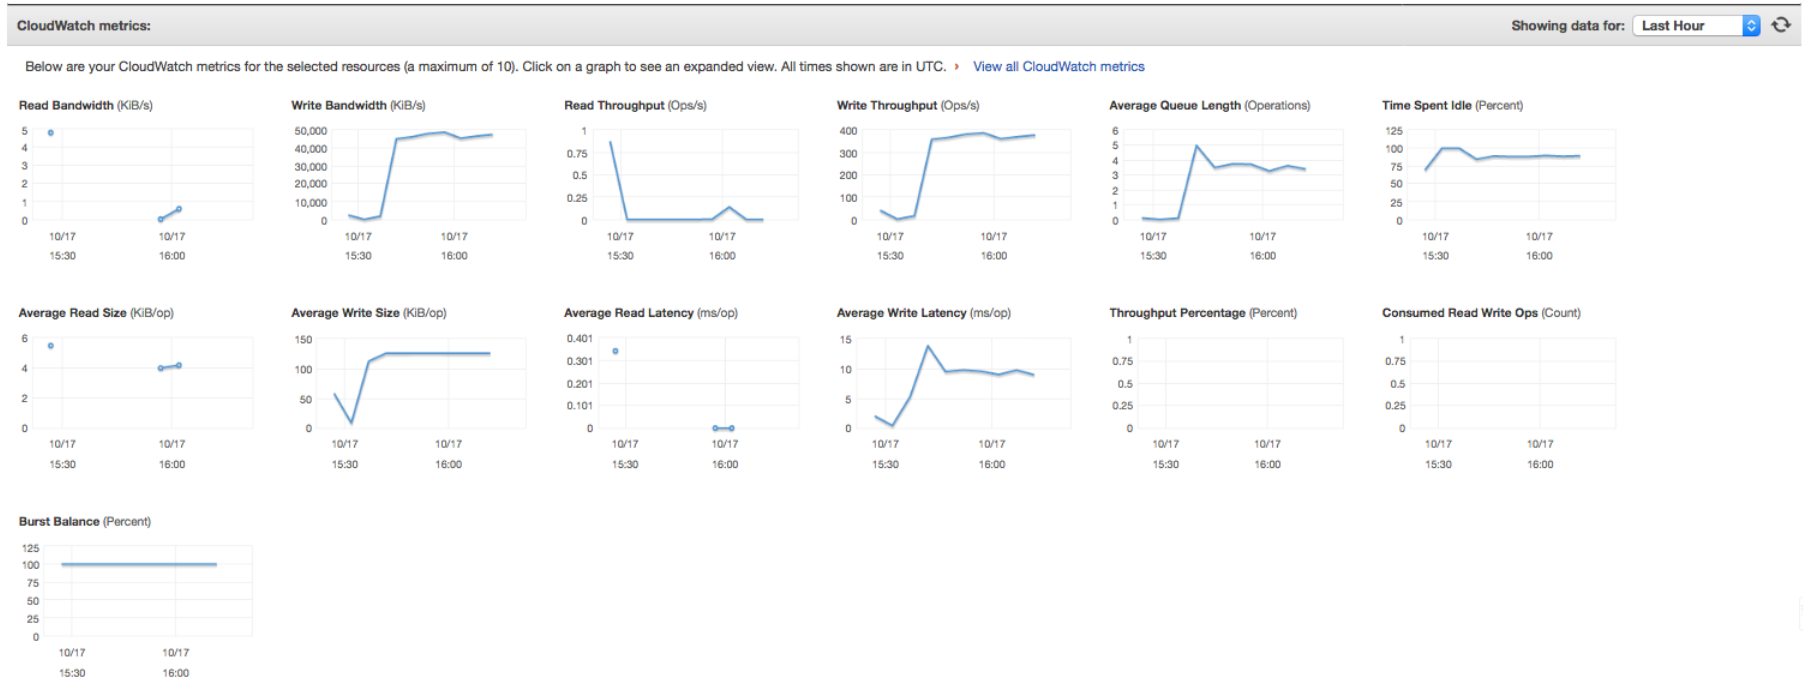
Look at some of the metrics: these are using the same instance type (m4.10xl – 500Mb/s throughput), same volume type (GP2 – 160Mb/s throughput) and running the same job:
